Farm-Fin Corp evaluated two potential farmland investments in China but needed to select one. To assist in their decision, Sustax data was used to analyse climate impacts from an investment perspective in both sites. The Northwest location (POI 1) presents a far more compelling and lower-risk opportunity for long-term agricultural investment.
- +16% Growth Potential: POI 1 shows a dramatically higher increase in heat accumulation (GDD) compared to POI 2’s +7.5% for the next 15 years.
- Lower Risk Profile: POI 1 historical record showed no extreme low-GDD events, unlike POI 2, indicating a more stable climate for crops.
- High Model Confidence: SSP4-3.4 scenario, which showed near-zero error (MBE) across China, validates the reliability of these projections for both sites.
Interactive Menu
The Investment Challenge ↑
Launching its first venture in China, Farm-Fin Corp faced a pivotal investment decision, selecting between two farmland sites located in distinctively different climatic regions. The inherent climatological difference raised pressing questions for any prudent investor:
Which location offers the most robust opportunity for stable and profitable crop production in a changing climate? How will climate change impacts on long-term heat availability and growing season dynamics?
This decision was a bet on which site would be more resilient to climate change. Thus, to move beyond guesswork, Farm-Fin Corp used Sustax’s data to make a quantifiable, evidence-based decision. The goal was to directly compare historical and future Growing Degree Days (GDD) for both sites to uncover the most climate-secure investment.
Quantifying Climate Resilience ↑
Faced with this complex choice, Farm-Fin Corp partnered with Sustax to transform climate uncertainty into a quantifiable, investment-grade analysis. We provided a rigorous, data-driven framework to compare the two sites. The analysis was built on the following Sustax datasets, downloaded for both locations:
- Multi-Scenario Projections: Projected GDD of 7 SSP scenarios from 2025 to 2040
- Historical Baseline: ERA5 historical GDD data (1995-2020) to establish a performance benchmark.
- Model Confidence Metrics:
- Spread of temperature (the baseline variable of GDD) for each scenario
- Mean Bias Error (MBE) of temperature (1979-2022) to validate model accuracy against historical observations.
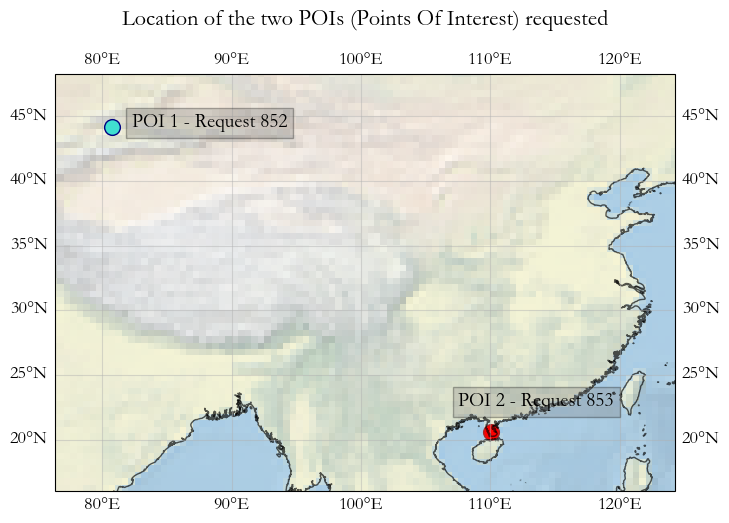
This allowed FF Corp to directly compare historical climatology, future climate impact, and reliability of our models at both points of interest (POIs) as shown in Figure 1.
Key Findings ↑
FF Corp’s analysis revealed a significant divergence in future crop growth potential between the two regions. The following data visualisations, built on our multi-scenario framework, shows why POI 1 in Northwest China presents a more robust and profitable opportunity.
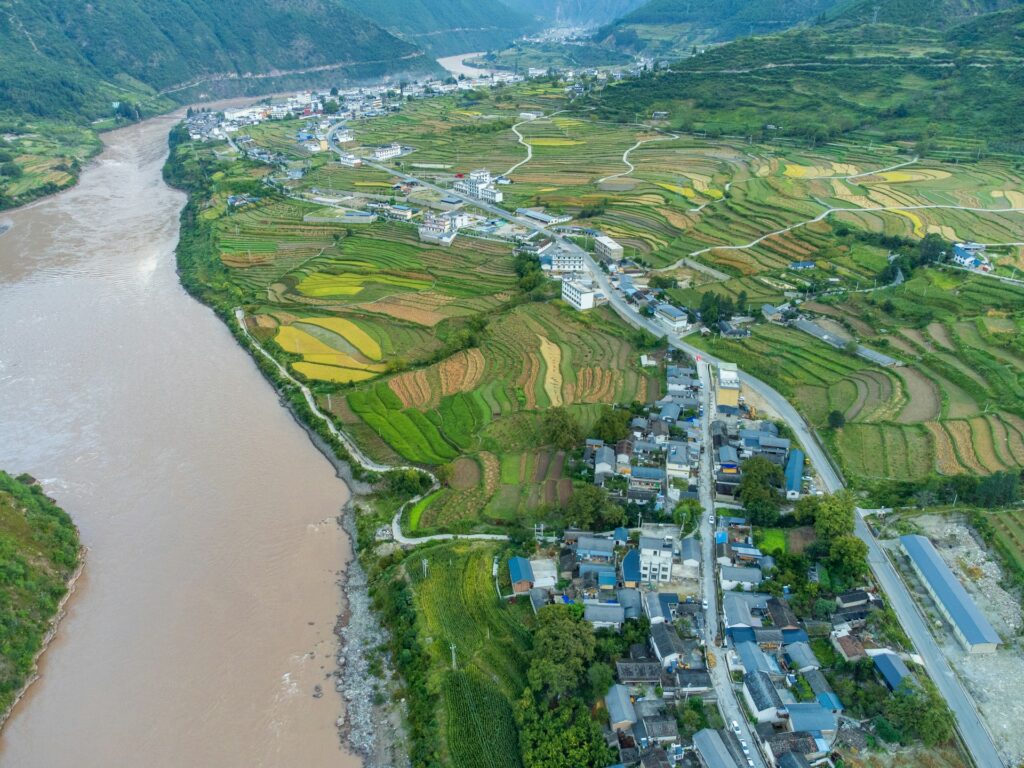
POI 1: Northwest China Farmland
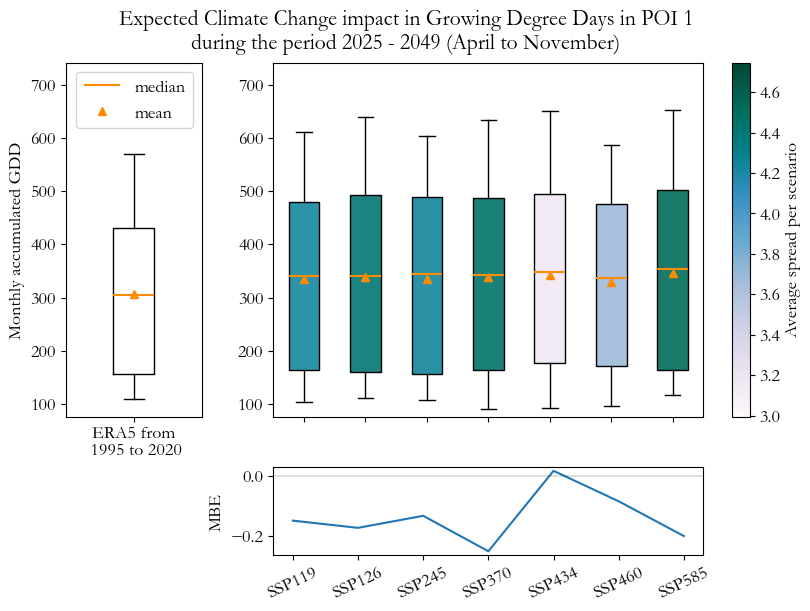
The plot above clearly highlights a robust upward trend in monthly Growing Degree Days (GDD) when comparing to the projected values (2025–2049, during the month from April–November) under all SSP scenarios compared to the historical ERA5 baseline (1995–2020). More specifically this upward trend can be quantified into a 16% on its average. Notably, extreme values (see whisker’s end) increase an 8.6% making this land interesting as extreme events will not rise as much as regular temperatures.
The scenario SSP 434 shows lower uncertainty (which is expected, as this scenario entails very few CMIP6 simulations) but also a near 0 mean bias error (MBE). This makes the scenario attractive to understand changes in the average GDD compared to baseline.
Note that MBE is an optimal metric to describe average values of a distribution.
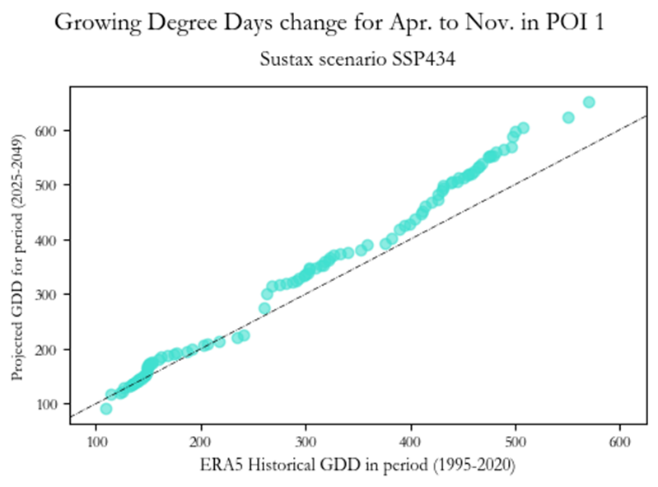
Figure 3 demonstrates SSP434 percentile points are consistently above the 1:1 reference line, meaning that, for every percentile, future GDDs are greater than their historical counterparts. This signals a strong increase in accumulated heat units, translating to a longer, warmer growing season and new opportunities for heat-demanding crops. No changes are expected for the minimum values of GDD.
POI 2: Southern Coastal China Farmland
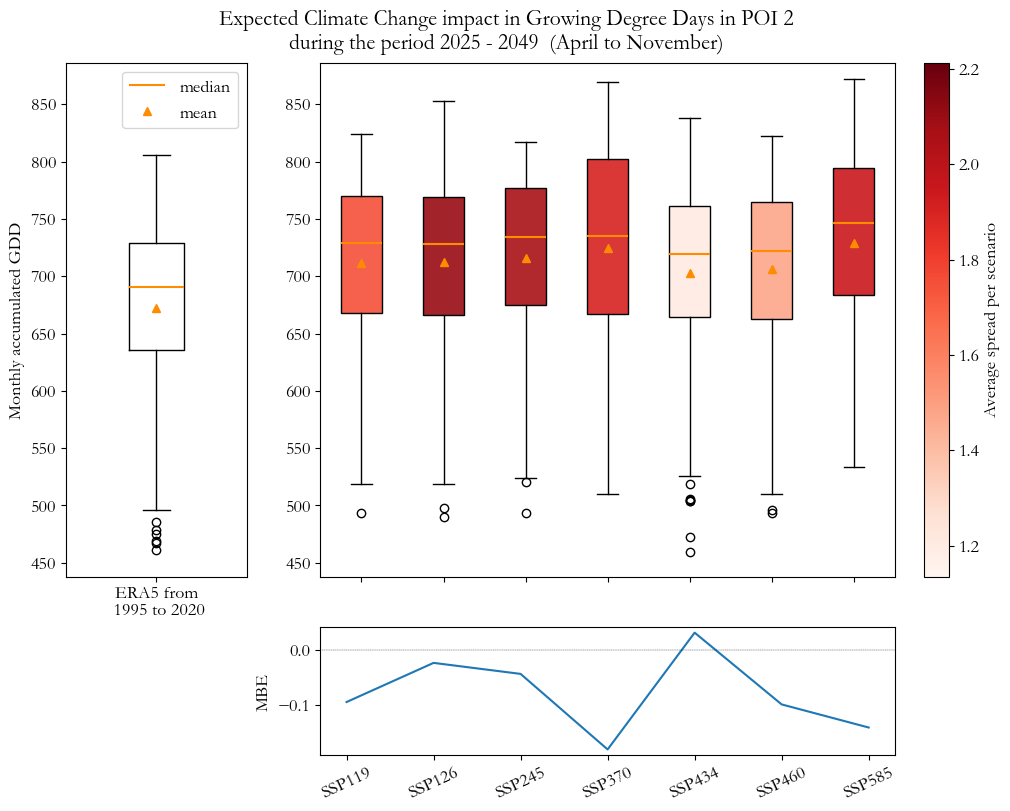
POI 2 presented a more modest warming (+7.5% GDD) but carried greater climate risk. While all scenarios projected increased heat accumulation, historical data revealed higher volatility and potential for damaging cold events—a significant risk for temperature-sensitive crops. The SSP4-3.4 scenario again showed the highest model confidence (lowest MBE), confirming geospatial reliability.
Conclusions ↑
Rather than relying on intuition or historic averages alone, Farm-Fin Corp quantified risks and opportunities using Sustax’s scenario-based datasets.
Farm-Fin Corp faced a critical capital allocation decision. By leveraging Sustax’s quantitative climate data, they moved from uncertainty to a defensible, high-confidence investment strategy, identifying a clear winner based on future-proofed growth potential. With the Bottom Line being that POI 1 (Northwest China) presented as a superior asset for long-term, climate-resilient returns.
| Investment Criteria | PO1 | PO2 | Business Implications |
|---|---|---|---|
| Projected Growth Potential | +16% | +7.5% | POI 1 offer over 2x the relative growth opportunity for heat-loving crops (i.e., heat hccumulation) |
| Volatility & Risk Profile | Stable Historical Data | History of Cold Events | POI 1 ensures more predictable yields and protects against season-to-season losses. The outliers detected in POI 2 indicate higher exposure to climate variability |
| Model Confidence | SSP-4.34 Low Error | SSP-4.34 Low Error | FF Corp projections are rigorously benchmarked with a clear stable SSP-RCP scenario for China, de-risking the investment thesis. |