
Real Estate LLC, a global real estate investment and management firm, conducted an exhaustive quantitative climate risk assessment for two UK assets (Asset N and Asset S), leveraging Sustax climate scenarios to project physical impacts on energy demand, extreme windstorms, and asset erosion.
- Energy demand: Heating energy requirements are projected to decrease by (-)5 to (-)24% in Asset N during winter, with minimal changes in Asset S (from a 10% reduction to a +2% increase), while cooling energy demand increases by 163–230% in Asset N and 109–240% in Asset S.
- Extreme windstorm: An Extreme Value Analysis (EVA) reveals a ~10% intensity decline in Asset N across most SSP scenarios, with the largest reductions at shorter return periods (e.g., 5-year, 20-year), contrasted by a 15 to 20% increase in Asset S for 5 out of the 7 SSPs, potentially converging the storm power between both sites.
- Asset erosion: Using the Modified Fournier Index (MFI), projected rainfall erosivity increases by about 20% at Asset N (with peaks up to 4 times historical variability) and by about 15% at Asset S.
These insights support climate finance strategies like Net Present Value (NPV) modelling for climate adaptation, estimating 10-25% higher exposure and potential a significant potential for value gains through targeted resilience investments, aligning Real Estate LLC with climate finance principles like those from the UNFCCC and green bonds frameworks.
Interactive Menu
- Quantitative Climate Finance with Sustax
- Case 1: Energy Consumption
- Case 2: Extreme Wind Storms
- Case 3: Asset Erosion
- From Climate Noise to Strategic Clarity
Quantitative Climate Finance with Sustax ↑
Real Estate LLC operates two office parks in the UK — one in Northern Great Britain (aka. Asset N) and the other one in Southern Great Britain (aka. Asset S). With energy bills on the rise, increasing regulatory pressure (i.e.; Sustainability Reporting Standards, UK- SRS), and concerns about long-term exposure to physical climate risks, the company’s leadership raised a simple but fundamental question:
Which of our assets is more vulnerable to climate — and what can we do about it?
As climate risk is becoming a strategy opportunity, Real Estate LLC was very aware that his wasn’t about weather forecasting. It was about making leading decisions for the next decades: where to invest in insulation, cooling systems, building upgrades, or even new insurance conditions. So, to answer to his question Real Estate LLC turned to Sustax. The goal: to transform climate data into strategic insights that empower the company to make informed, profitable and location-specific decisions.
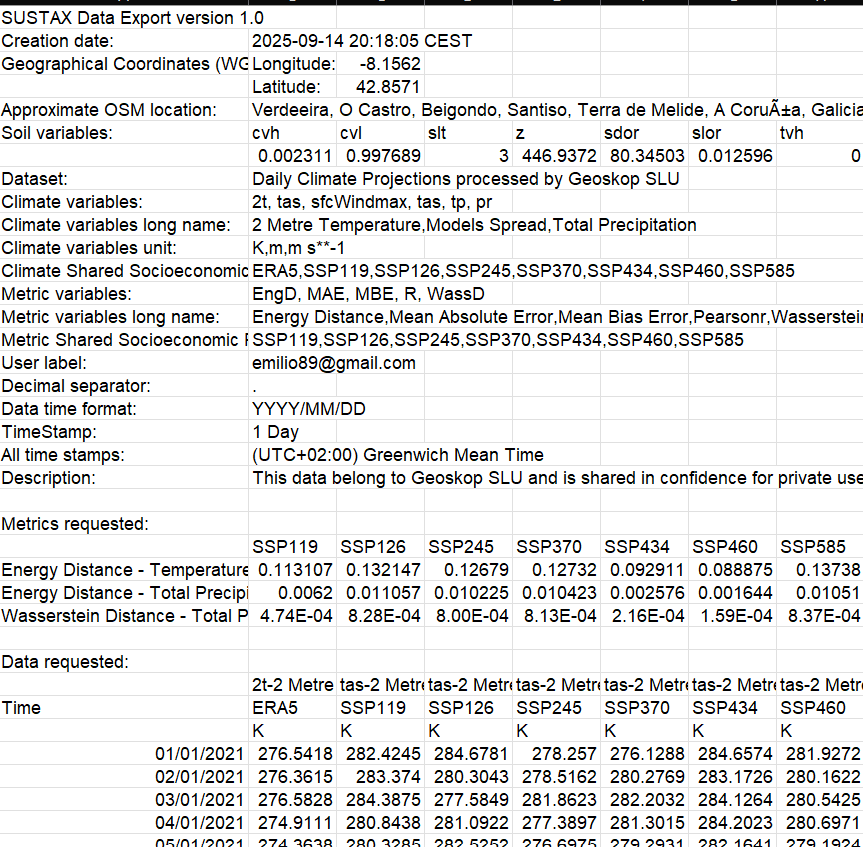
By using Sustax Real Estate LLC unlock access to global insights within few minutes
- A standardized CSV file, directly interpretable in M. Excel, Python R, or even generative AI models – LLMs
- Full traceability and automation of their requests via their Sustax account
- Raw data ready for custom analysis and visualisation, related with temperature, precipitation, humidity and wind climate perils at a global scale
Case 1: Energy Consumption ↑
With growing concern over utility expenses and operational emissions, Real Estate LLC wanted to estimate how future climate scenarios would affect energy consumption in both of its offices.
Would winters become milder? Would summers turn unbearably hot? Would potential heating savings overcome expected cooling expenses?
By providing quantitative answers, Sustax helps Real Estate LLC adopt smarter strategies for retrofitting and risk management, yielding benefits like decreased utility expenses and safeguarding property values amid evolving climate challenges.
But, how did Real Estate LLC used Sustax to answer this questions? With Sustax platform, a custom dataset is obtained in less than a minute. The setup included:
- Two postcodes: One for each asset (i.e., Asset N and Asset S)
- Sustax variable/s: Monthly Heating Degree Days (HDD) and Cooling Degree Days (CDD)
- Three SSP scenarios: Specifically, SSP3-7.0, SSP4-6.0 and SSP5-8.5
- Timeframe: 85 years of data (including historical and projection)
To analyse the energy consumption the Real Estate LLC wants to put himself in the worse case scenarios. Thus, the Sustax’s scenarios SSP3-7.0, SSP4-6.0 and the SSP5-8.5 are selected for this case. Both data variables, HDD and CDD are projected for the months of winter (Oct to Apr) and summer (May to Sep) respectively. The projection period is split into 3 predictive periods (2025 to 2045, 2046 to 2062, and 2063 to 2079). Besides, an historical period used as a comparative baseline, from 1999 to 2015 .
Key findings
To quantify the impacts on HDD and CDD, a Quantile-Quantile plot (represented by percentiles 0, 10, 20, 30, … 100) is generated. The Y-axis contains a predictive period and the X-axis the historical period (common baseline). The resulting slope from the Q-Q is fit in a linear regression to estimate the slope. A slope of 1 (i.e., 45º) involves no change between the predictive period and the historical baseline. A slope above 1, involves positive change and below 1, negative change.
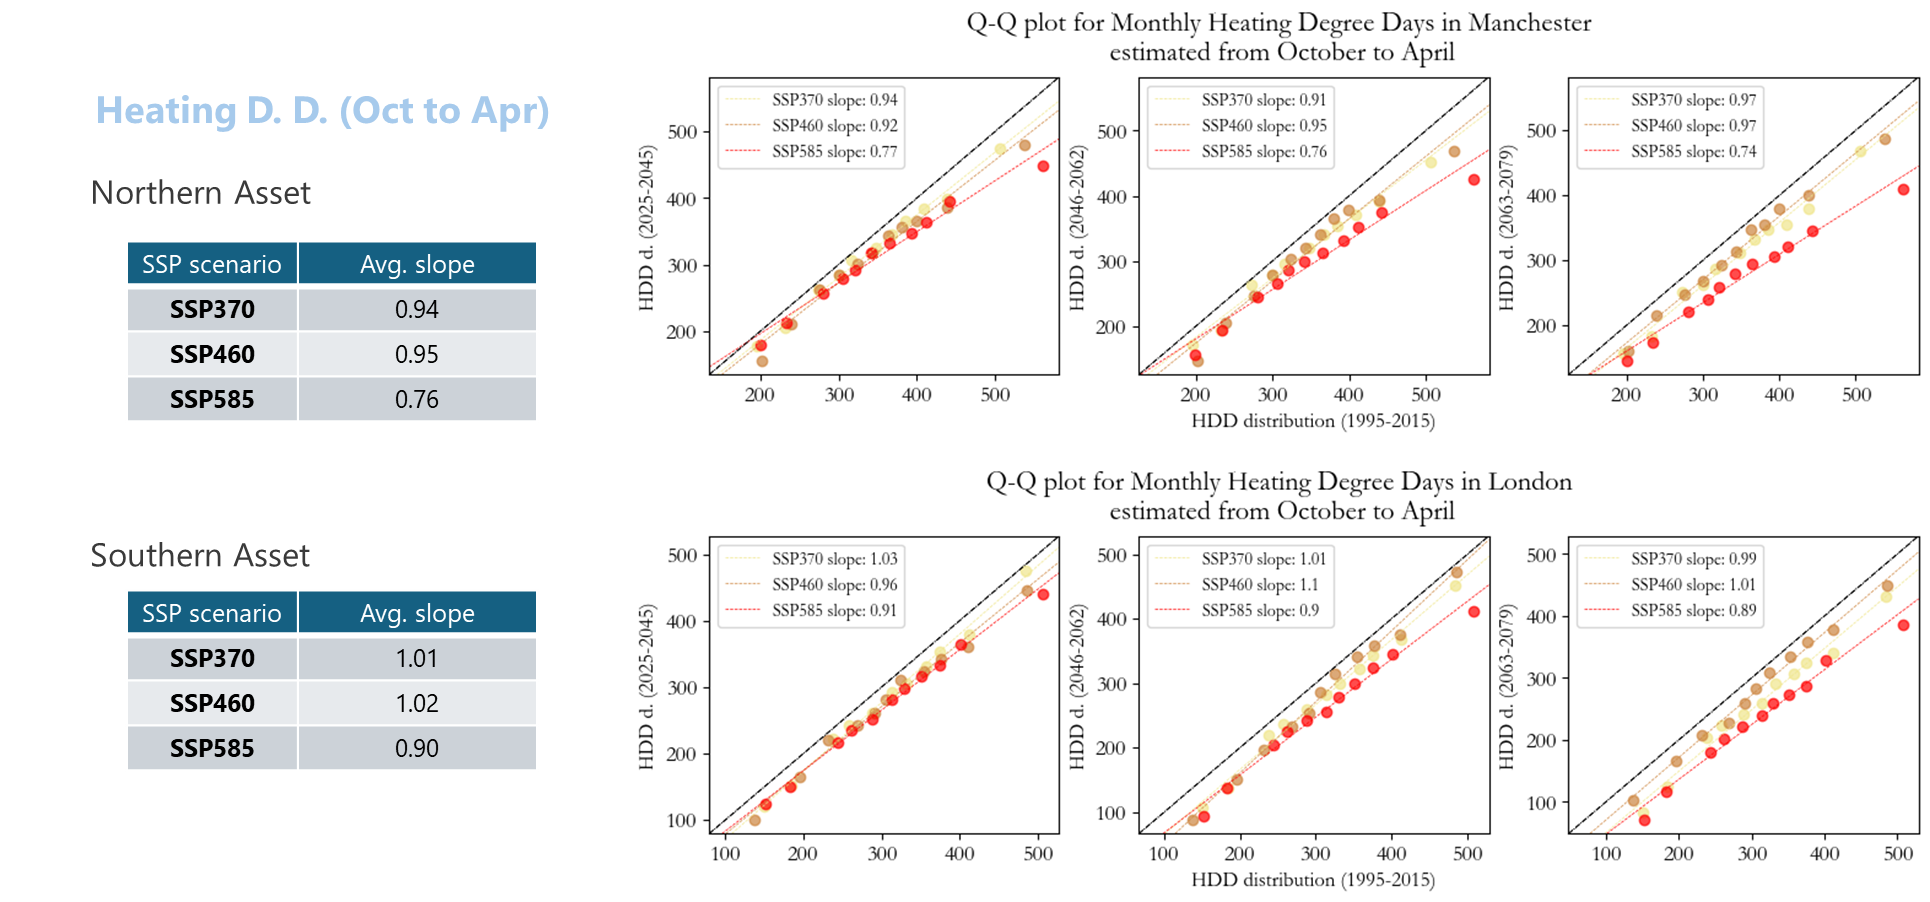
The image above corresponds to the Q-Q plot for Heating Degree Days estimated in Asset N and Asset S. All the selected scenarios (SSP3-7.0, SSP4-6.0, and SSP5-8.5) show slopes below or near 1, reflecting a slight reduction in winter heating demand as the climate warms. The slope estimation allows Real Estate LLC to extrapolate the impacts over their energy bills
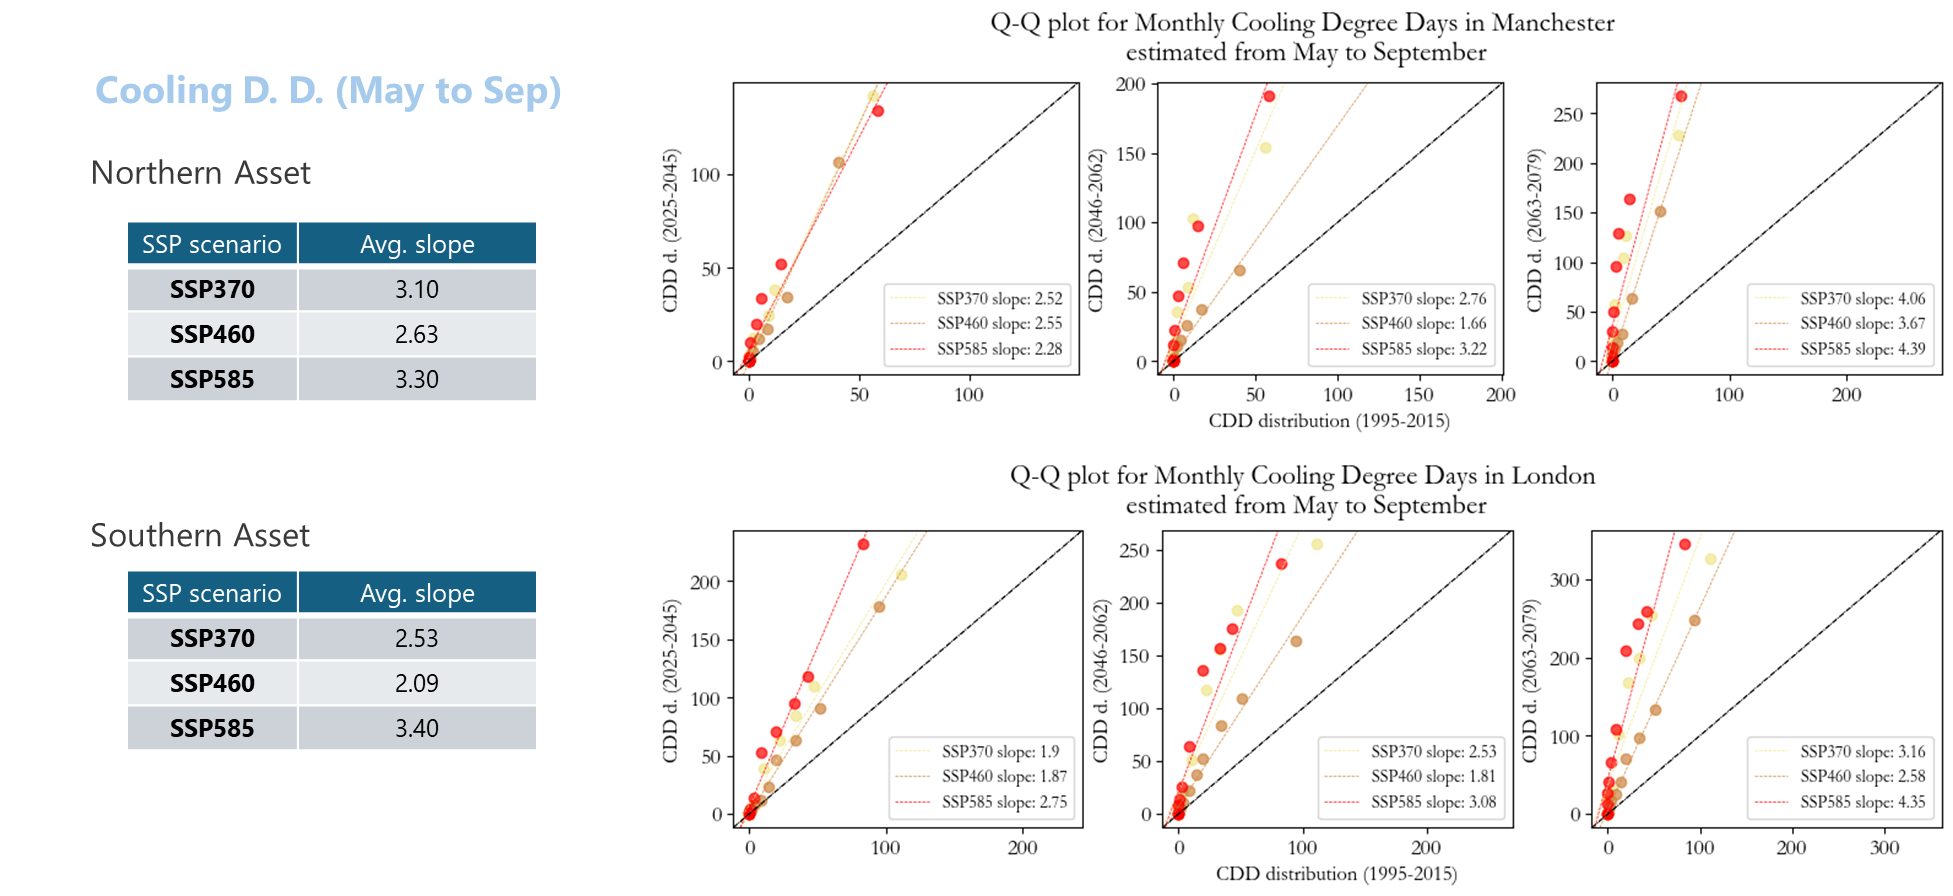
This second image corresponds to how future cooling energy demand is projected to change for Real Estate LLC’s assets during summer months (May to September), under the same three high-emissions climate scenarios. Notably, all scenarios show sharply increased cooling and isolation needs.
Summarising the key findings, the Q-Q plots provide both, qualitative an quantitative information, which could be summarized as:
- The Northern Asset is expected to benefit from a notable reduction in heating demand, with HDD dropping on winter — a drop that can range from 0.95 to 0.76.
- The Southern heating needs remain nearly stable (between 1.02 to 0.90), but cooling demand increases — expected from 2.09 up to 3.4.
- Asset N. cooling energy needs rise sharply, from 2.63 to 3.3.
Interestingly, Asset N. shows a lower standard deviation in cooling projections, meaning there’s higher confidence in the projected summer risks.
Conclusions
The conclusions are clear: Heating Less but Cooling More, but now Real Estate LLC can quantify the energy consumption costs. Once the slopes are calculated, we can use them as a correction factor over a hypothetical monthly consumption. Assuming that Real Estate LLC has a monthly consumption of 1 unit (and an equally distributed yearly consumption of 12 units), we can conclude that:
- The annual energy consumption ranges under different best-case worse case scenarios:
- Asset N: [19.80 – 21.82] units per year
- Asset S: [17.52 – 23.30] units per year
- Thus, Asset N. shas an oversized heating unit while will have to adapt its cooling capacity to an expected 75% more of cooling.
- Asset S. will need more adaptation efforts in terms of Cooling and related isolation, while not adaptation efforts in Heating are expected
Case 2: Extreme Wind Storms ↑
Windstorms represent one of the most unpredictable and potentially damaging climate risks for property stakeholders in urban environments. Traditionally, risk assessments have relied on historical records or simple SSP averages, overlooking how rare but severe wind gusts could evolve under different climate futures. After a series of insurance claims and local alerts about windstorms, Real Estate LLC began to worry:
What if extreme windstorm events become more frequent or more intense?
The problem? Regulatory frameworks such as the American Society of Civil Engineers’ ASCE 7 standard set wind load requirements based on uniform risk criteria (i.e., wind maps linked to specific return periods of 300, 700, and even 3,000 years). The solution? Sustax allows you to use scientific evidence to extrapolate these return periods into the future, enabling a sensitivity analysis of how windstorms will change during different prediction periods.
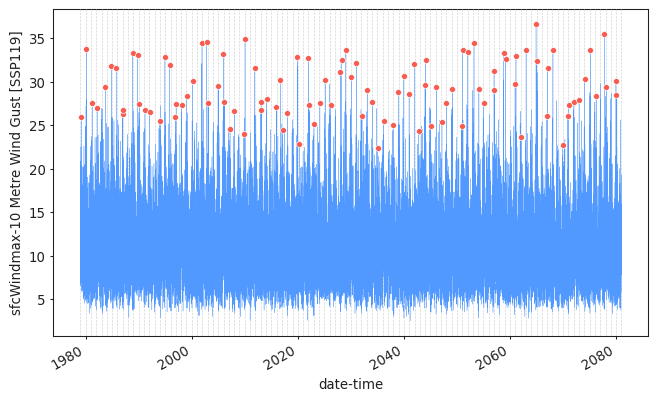
By using the Sustax platform, a custom dataset is obtained in less than a minute. The data request included:
- Two postcodes: One for each asset (i.e., Asset N and Asset S)
- Sustax variable/s: Daily maximum 3-second wind gust
- Seven SSP scenarios: From SSP1-1.9 to SSP5-8.5
- Timeframe: 102 years of data (including historical and projection)
This dataset enabled an Real Estate LLC to carry a unique Extreme Value Analysis (EVA) to project and quantify intensity shifts in the future.
Key findings
Sustax’s data provides Real Estate LLC with the flexibility to adapt its climate risk analysis to traditional engineering and risk standards, such as Extreme Value Analysis (EVA), to estimate how the Return Periods (RPs) of extreme wind gust events are shifting over time.
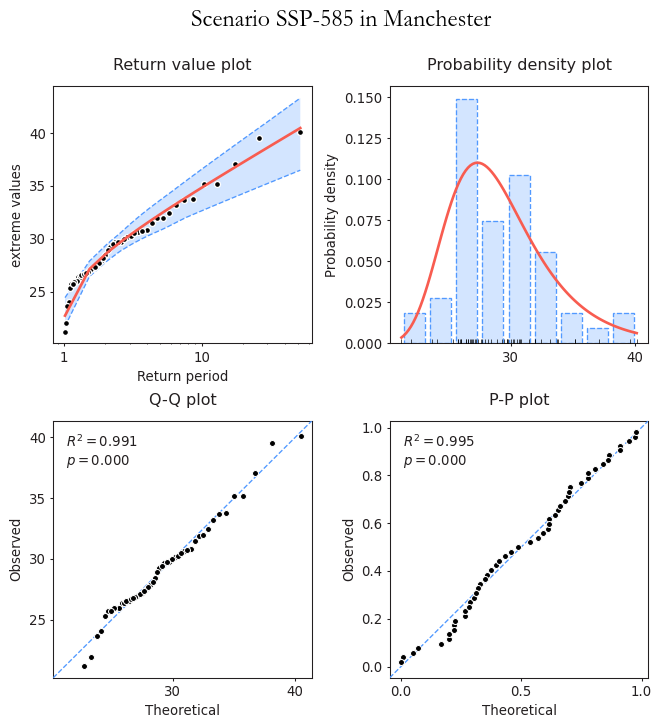
Each Sustax SSP scenario is fitted using the Generalized Extreme Value Distribution (GEVD), with the optimal fit determined by maximum likelihood under the Akaike Information Criterion (AIC). This enables analysis of different Return Periods (e.g., 5, 20, 100, and 600 years) for each SSP scenario. The images below illustrate the changes in Asset N and Asset S for the four RPs and the associated uncertainty. The analysis takes a holistic approach, incorporating up to seven SSP scenarios. As a result, Real Estate LLC benefits from:
- Multi-scenario modelling: Simultaneous use of all seven SSPs for a comprehensive perspective, enabling big data-scenario agnostic analysis rather than limited storytelling from a single SSP (note that, according to science, using multiple SSP without strictly adhering to their individual narratives offers a robust way to capture uncertainty. This method is well-supported in top research Riahi et al. (2017), O’Neil et al. (2020), Tebaldi et al. (2021), Jiang et al. (2022))
- Quantitative analysis: Directly using Sustax’s predictive scenario-data while adhering to standard risk methodologies and return periods calculated via Block Maxima theory (BM): 5, 20, 100, and 600 years.
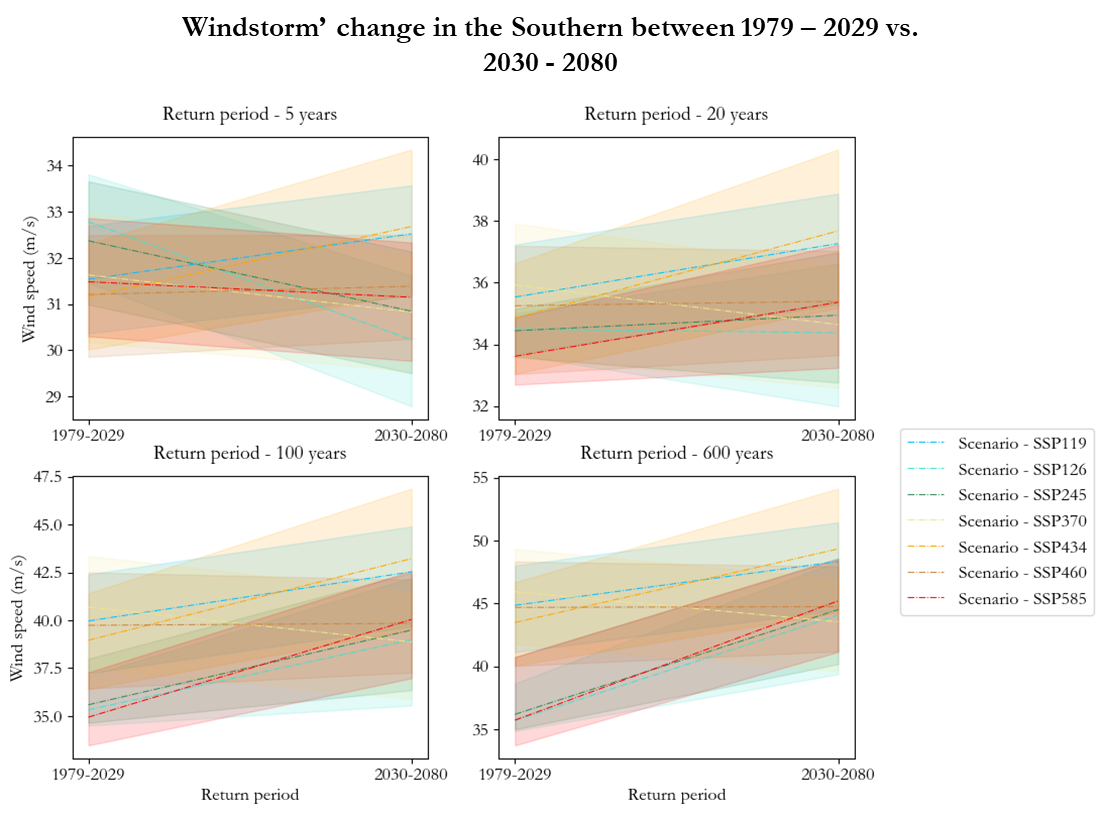
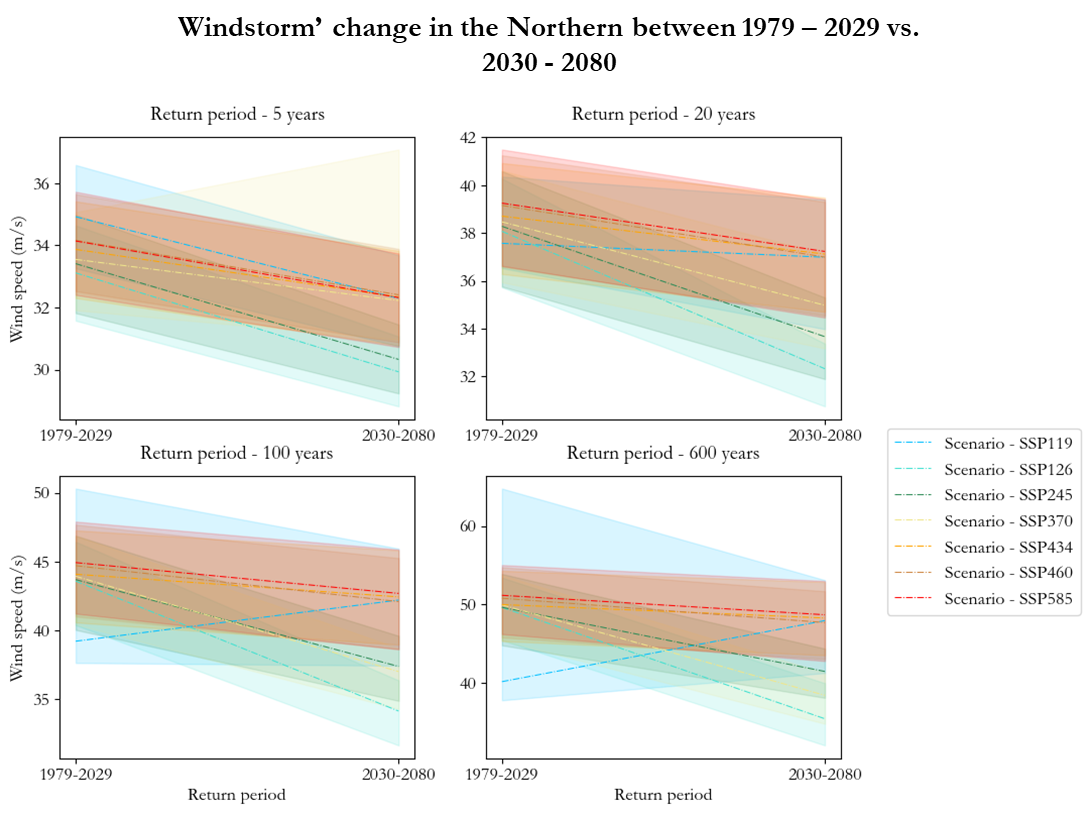
The changes in EVA return periods are evaluated for the historical period (1979–2029) and the prediction period (2030–2080). To summarise Real Estate LLC’s key findings, it is highlighted:
- The Northern Asset is exposed to heavier storms compared to the Southern one, yet it shows a light decline in intensity. On average, this decline is of a 10% in wind intensity, with only 1 scenario out of 7 (SSP 1-1.9) showing an increase of intensity.
- Overall, the shorter the return period, the more significant the decline in wind intensity.
- In Asset S. though, large windstorms will increase in intensity significantly, with 5 scenarios out of 7 pointing to a 15-20% rise.
- Extreme storms in Asset S. are a 20% less powerful than in Asset N., yet with climate change, they could end at the same level.
Conclusions
Being the Southern Asset (aka Asset S.) not flagged as “at risk” in traditional wind maps, , this Sustax-driven analysis has fundamentally shifted internal discussions on climate vulnerability. The key takeaways are:
- While Asset N. currently faces stronger windstorms, its projected decline in intensity suggests it is prepared for future conditions.
- In contrast, Asset S. —deemed low-risk today— faces a 15-20% intensity increase in 5 of 7 SSPs, potentially converging with Asset N’s levels under climate change.
- This implies that Asset N. existing windstorm design standards could serve as a benchmark for Asset S. future resilience measures.
- Notably, only Asset S exhibits significant climate-driven intensification, highlighting the urgency for site-specific strategies to mitigate 10-25% higher exposure risks.
Thanks to Sustax, Real Estate LLC can perform quantitative risk analyses based in IPCC CMIP6 , complementing traditional risk-methods like Extreme Value Analysis (EVA). Conventional insurance offers reactive coverage, but Sustax provides proactive insights through multi-scenario data and standard engineering metrics, enabling NPV modelling for adaptations that could yield 5-15% value gains in resilience.
Case 3: Asset Erosion ↑
Real Estate LLC has typically percieved rain-driven erosion as routine maintenance concerns rather than strategic risks. However, with shifting precipitation patterns and intensities, the company began to wondering:
How vulnerable are our assets to long-term erosion, and where should we prioritise protection efforts?
To understand how climate change might accelerate building degradation through precipitation, the historical and future data from Sustax in both POIs was requested:
- Two postcodes: One for each asset (i.e., Asset N and Asset S)
- Sustax variable/s: Modified Fournier Index (MFI), the Mean Absolute Error (MAE) as an accuracy metric for precipitation, and the Daily Spread as a metric of uncertainty
- Timeframe: From 2000 to 2040 using symmetrical periods for comparison
- Scenarios: All 7 SSP climate scenarios plus ECMWF ERA5 (also available in Sustax)
The Modified Fournier Index (MFI), is a monthly climate index that quantifies rainfall aggressiveness, offering critical insights on erosion potential. By combining the MFI index with statistical confidence (through MAE), Sustax enables Real Estate LLC to not only predict potential increases in erosion but also to quantify the expected certainty of this risks. Incorporating ERA5 provides a reliable historical baseline, enabling the company to clearly identify changes and trends over time.
Key Findings
A holistic assessment of the Modified Fournier Index (MFI) impacts was performed for each of Real Estate LLC’s assets. To effectively visualize changes, the distributions of each SSP scenario alongside ERA5 observations are displayed using violin plots, which provide a detailed view of data density similar to boxplots. Horizontal lines within these plots indicate the 25th, 50th, and 75th percentiles.
The comparative analysis covers the ERA5 historical baseline (2000-2015) and future projections from Sustax for 2025-2040 across seven SSPs.
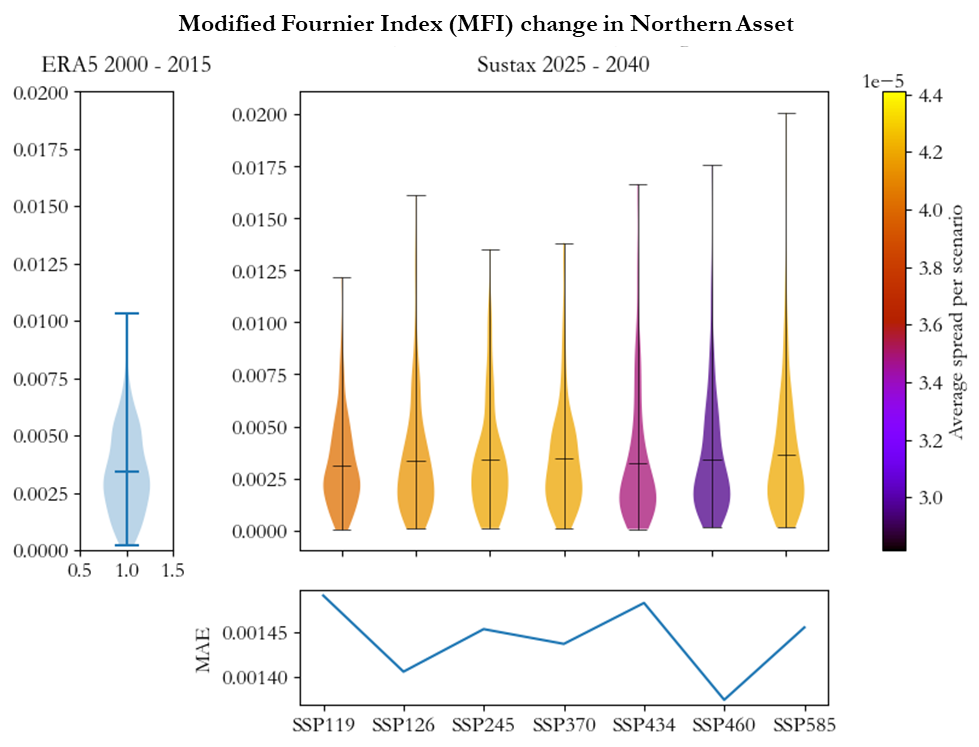
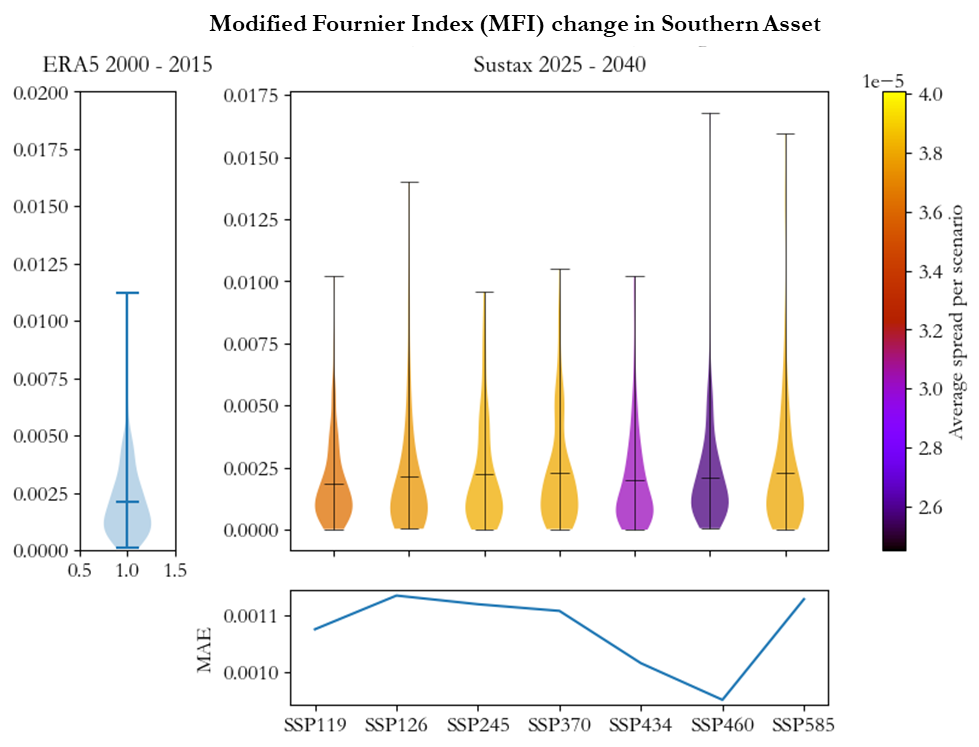
Such plot structure provides quantitative and qualitative insights for Real State LLC. The ERA5 MFI distribution (i.e.: historical distribution from 2000 to 2015) is relatively narrow and concentrated at lower values, indicating modest rainfall erosivity during the baseline period. Future projections with Sustax display wider violin plots, stretching towards higher MFI values across all scenarios. This signifies both a potential increase in rainfall aggressiveness and greater variability in projected outcomes.
The colour gradient, from purple to yellow, denotes scenario-specific spreads, which consider the original uncertainty from CMIP6 multimodel ensemble.
On the lower side of the plots, the MAE (Mean Absolute Error) panel for precipitation, with similar values, it indicates a stable model accuracy over the historical period and strengthening confidence in these projections.
- Both assets are projected to experience changes in rainfall patterns, with the Northern Asset likely to face more pronounced impacts.
- Future rainfall is expected to become more concentrated in fewer months, enhancing precipitation’s erosive potential.
- SSP4-6.0 exhibits the lowest MAE and some months of notably heightened erosivity, corroborated by SSP5-8.5 projections.
Please note that MAE’s values are small as they are calculated over daily precipitation in m. (not mm.)
Conclusions
The notion that “the North is stormy” remains valid, as Sustax projections indicate both assets will encounter heightened rainfall erosivity and increased volatility. Quantitative MFI analysis shows the Northern Asset facing ~20% higher erosivity (with peaks up to 4x historical variability) and the Southern Asset ~15% higher, driven by more concentrated rainfall patterns under scenarios like SSP4-6.0 and SSP5-8.5. The lowest Mean Absolute Errors (MAE) in both assets confirm this behaviour, while emphasising Asset N. greater vulnerability to intense erosion events.
These insights directly guide proactive risk management, signaling shifts in insurance underwriting where capital at risk could rise 10-25% beyond ERA5 historical baselines (i.e., actual observations) due to accelerated building degradation.
With Sustax, erosion isn’t just a maintenance issue — it’s a climate strategy.
From Climate Noise to Strategic Clarity ↑
Real Estate LLC often encountered climate services that simply indicate “things will probably get worse”. These services provide visually appealing charts and risk scores ranging from A to E, or similar ambiguous indices; however, they all lack transparency and scalability, impeding effective decision-making
Sustax changes that.
With Sustax, you move beyond climate storytelling and into climate finance strategy:
- You receive quantitative climate metrics, not just stylized summaries
- Every scenario includes accuracy indicators, like Mean Absolute Error and original Model Spread, to evaluate model reliability
- You get raw, traceable data, delivered in minutes, ready to use in M. Excel, Python, or your own tools. We guarantee maximum flexibility in your request, from 1 year and 1 SSP scenario to 102 years and 7 SSP scenarios.
- You gain access to the full range of SSP scenarios, not just an average or worst-case guess
Across the three cases — energy consumption, extreme gust of wind, and precipitation erosion — Sustax enabled Real Estate LLC to:
- Understand risk by location, not by general region
- Translate climate data into financial and operational planning
- Make informed, future-ready decisions with confidence
Climate change is complicated. Your next move shouldn’t be. Sustax gives you the clarity, granularity, and transparency other tools lack, so that you can stop guessing, and start preparing.
Whether you’re managing corporate assets, underwriting insurance portfolios, or designing climate-resilient infrastructure — Sustax equips you with the metrics that matter.
Request your free demo and discover how easy it is to turn climate uncertainty into actionable insights tailored to your locations.