
A standardised framework is designed for decision-makers at ports and associated infrastructure. Sustax provided the critical data, delivering a multi-model analysis of future daily and extreme precipitation across all climate scenarios for the framework. This gave PortCo the robust, scientific foundation needed to build a future-proof port.
- Scientifically Defensible: Using quantitative metrics to assess the severity and likelihood of climate risks.
- Transparent & Trusted: Meeting growing regulatory and investor demands for climate-resilient infrastructure.
This case study exemplifies international best practices for climate adaptation, following recommendations like the ISO 14091:2021 framework. By integrating the Sustax climate data suite with this rigorous framework, PortCo’s delivers clear scientific evidence of climate change impacts, presents quantitatively defined future scenarios with uncertainty ranges, and facilitates straightforward interpretation for strategic decision-making.
Interactive Menu
The Business Risks of Rainfall ↑
The core challenge for PortCo was to help its client address the uncertainty of how future precipitation could strain the drainage systems, increase flood risks, and disrupt operations. Furthermore, the port vulnerability to precipitation extends well beyond the directs impacts. For instance, heavy and persistent rainfall can (Asariotis, R.; et. al.):
- Structural Damage: Intense rainfall (measured Modified Fournier Index in Sustax) weakening foundations and retaining walls. This drives up maintenance costs.
- Disrupted operations: Poor visibility, unsafe docking, or cargo-handling difficulties can delay or cancel ship movements.
- Environmental risks: Overwhelm pollution controls, leading to hazardous spills, water contamination, and sediment buildup in navigation channels.
- Rising financial burdens: Higher insurance premiums, stricter coverage terms, and more expensive claims.
To address this challenge, PortCo developed a standardised framework designed for decision-makers at ports and related infrastructure. This framework provides a systematic, data-driven approach to identify, analyse, and manage precipitation-related risks based on Sustax. By leveraging Sustax’s multi-scenario climate projections, quantitative climate data and related accuracy metrics (i.e., Energy Distance), PortCo’s innovative framework helped identify which climate scenarios are most credible and to quantify expected shifts in both average and extreme daily rainfall.
The proposed methodology enables a first-tier comprehensive assessment of susceptibility and exposure to current and future climate hazards in an standardised manner. Thus, enabling port’s management to prioritise infrastructure upgrades based on the most plausible future rainfall patterns, tailor operational protocols to anticipated weather extremes, and allocate resources more effectively.
Effective adaptation guaranteed that every dollar invested not only helps reduce future insurance claims, premiums, and liability risks, but also safeguards the port’s reputation as a reliable partner and protects local communities and supply chains from costly disruptions.
Quantifying Climate Resilience ↑
In this study case PortCo utilizes:
- One POI: Obtained by geographical coordinates
- Sustax variable/s: Daily Accumulated Precipitation and Energy Distance (EngD)
- Seven SSP scenarios: From SSP-1.19 all the way to SSP5-.85
- Timeframe: 50 years of data (from 1981 to 2010 and from 2031 to 2060)
Once all the data is retrieved from Sustax, PortCo follows the following simple steps:
Step 1: Ranking Scenarios by Accuracy
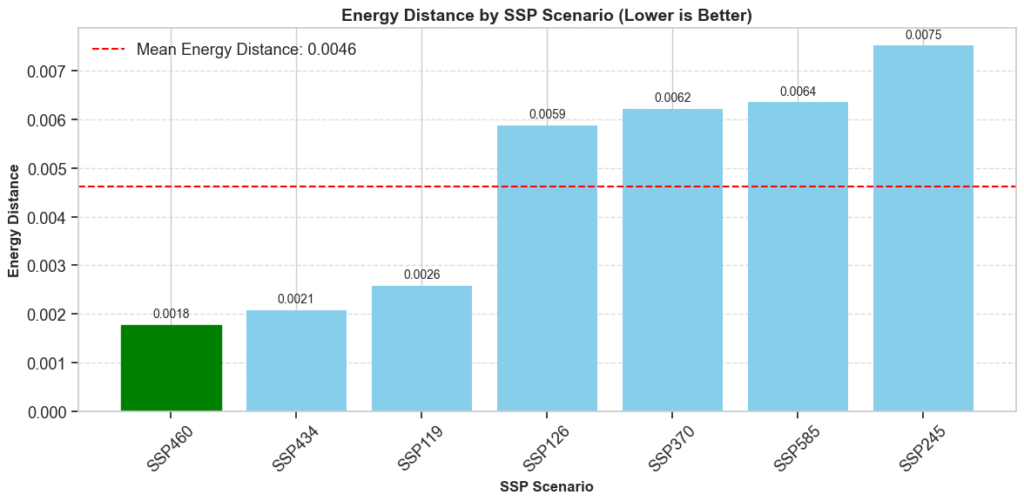
The first step used Energy Distance’s accuracy metric values for daily precipitation to rank the available SSP-RCP scenarios. Scenarios with lower EngD values demonstrated a closer match to historical precipitation distribution (i.e.: ERA5) during the validation period.
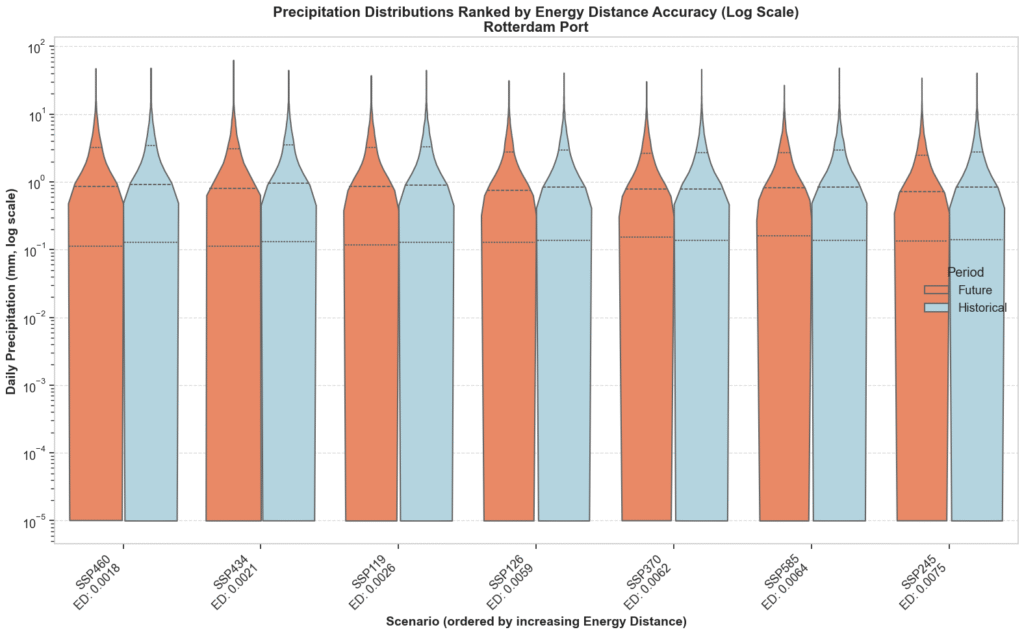
Step 2: Visualizing Precipitation Distribution Shifts
Violin plots and histograms can be used to compare the full probability distribution of daily precipitation (both on linear and log scales to capture extremes) for the historical period (blue violin) and the future projection (orange violin). PortCo was able to visualise and quantify the amount of change in precipitation regime in 7 different SSP scenarios, ordered by the Energy Distance metric (the lower the better).
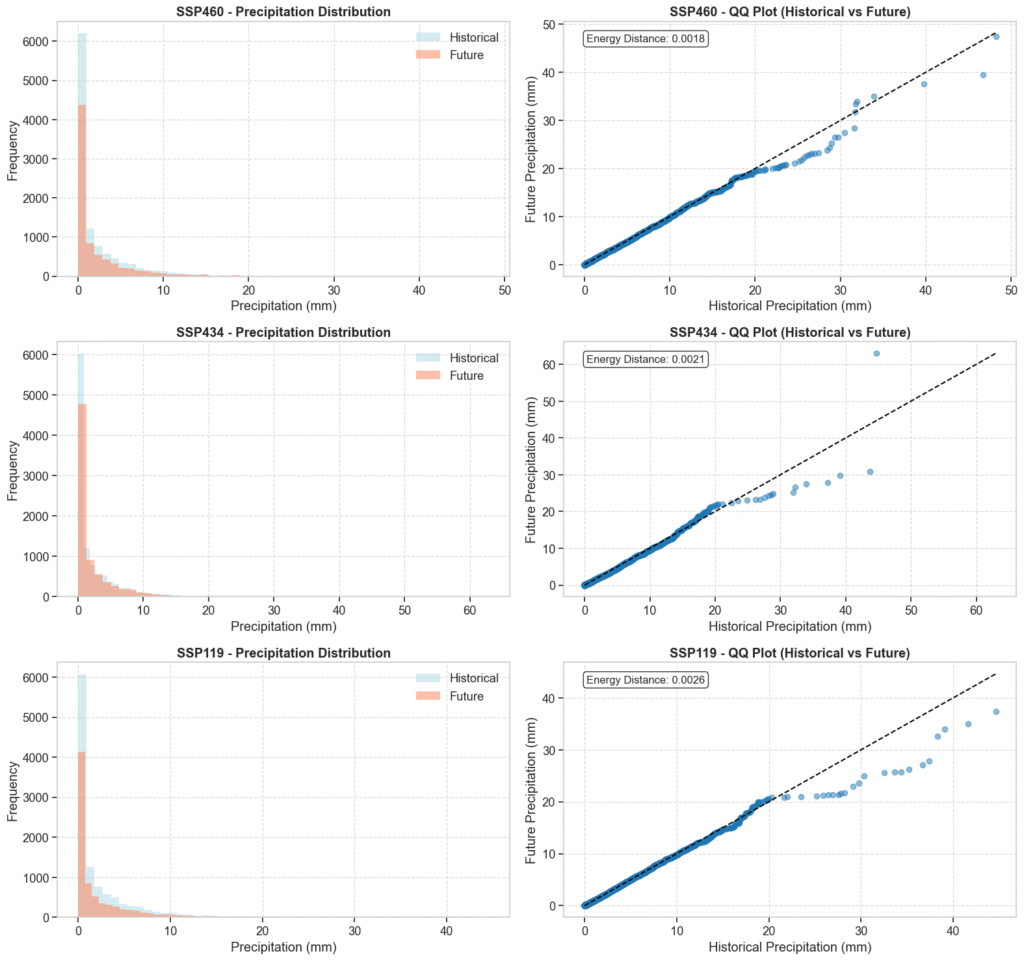
Step 3: Detailed Comparison of High-Accuracy Scenarios
For scenarios identified as having higher historical accuracy (lower EngD), Q-Q plots compared the quantiles of their future precipitation distributions directly against the historical distribution, visually highlighting the magnitude of projected changes across different precipitation intensities.
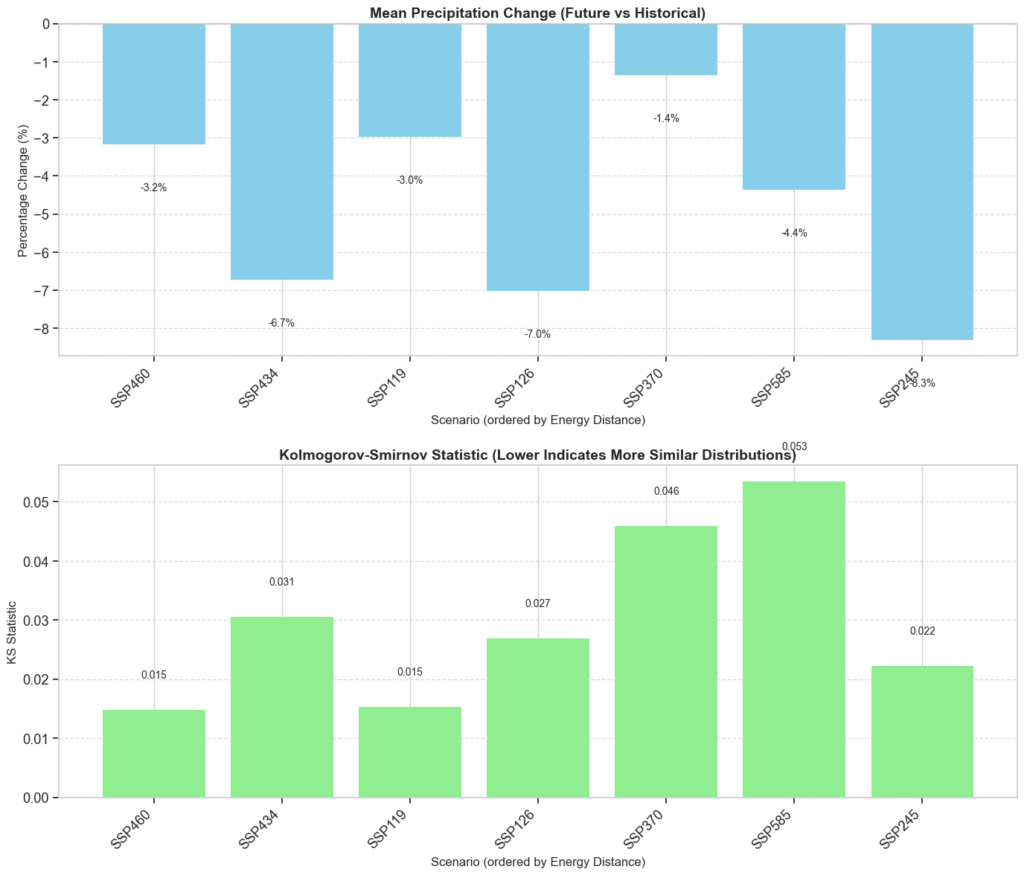
Step 4: Quantifying Changes & Statistical Significance
Beyond visualisations, statistical comparisons (percentage change in mean/median precipitation, and Kolmogorov-Smirnov tests for differences in distributions) can provide quantitative measures of projected changes for each scenario.
Key Findings ↑
One of the most important outcome: while average rainfall is expected to decrease, but some scenarios (see SSP4-6.0 and SSP4-3.4) show an increase in the intensity of extreme rainfall events.
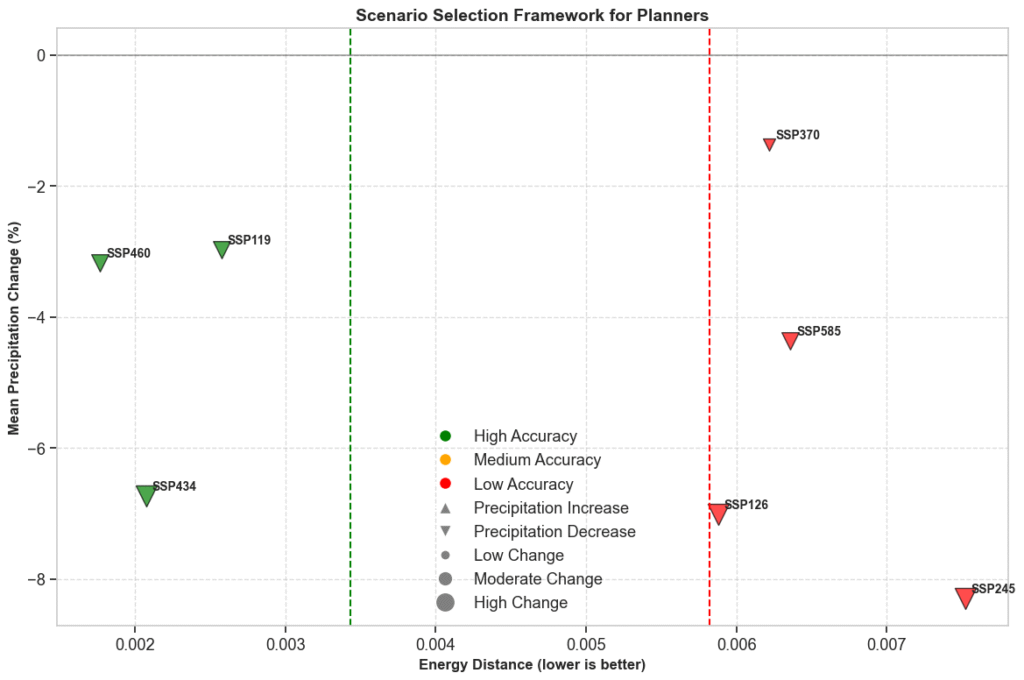
Building on these insights, Sustax enabled PortCo to develop a Scenario Selection Framework for Decision-Makers, by combining Energy Distance (a measure of model accuracy), the magnitude of projected change, and statistical tests, planners can systematically evaluate and quantify climate scenarios. This framework helped distinguish which scenarios are most reliable for core planning (“Primary for Planning”), which are suitable for exploring a broader range of outcomes (“Secondary for Sensitivity Analysis”), and which represent extreme but plausible futures for stress-testing resilience (“For Extreme Stress-Testing”). This structured approach allow port authorities to make informed, defensible decisions amid climate uncertainty.
Conclusions ↑
When extreme rainfall events become more intense, even if average precipitation declines, ports face a dual challenge. On one hand, reduced average rainfall may lower the baseline risk of chronic waterlogging and certain types of erosion. On the other hand, the increased intensity of extreme precipitation raises the likelihood of sudden, severe flooding and flash runoff, events that can overwhelm drainage systems; damage infrastructure; disrupt operations; or even trigger costly emergencies. Ultimately, this shift means that while the overall volume of rain may be less, the potential for acute, high-impact disasters grows.
Drawing from the most accurate scenarios evaluated via Energy Distance metrics (as shown in the framework of Figure 5), the projected precipitation regime change between the periods 1981–2010 and 2031–2060 are as follows:
| Type of precipitation | Lower threshold of change | Higher threshold of change |
| Average rain | -3.1% | -6.6% |
| Extreme precipitation | -12.8% | +34.7% |
To finalize, a standardised Framework for Port Decision-Makers and related infrastructure has been developed, using only Sustax data. This framework categorises scenarios into “Primary for Planning”, “Secondary for Sensitivity Analysis”, and “For Extreme Stress-Testing”. The framework also delivers scenario-agnostic quantitative thresholds across any time horizon. This approach equips leaders with the tools to make informed, data-driven decisions and adapt insights for broader economic and industrial uses.