To download custom Sustax climate data as CSV files, use the Sustax Toolbar positioned on the right side of the homepage. This toolbar provides seamless access to tens of terabytes of tailored climate data in just a few clicks. For complete flexibility, the data selection is divided into three steps:
- Climate parameters
- Geographical parameters
- Time parameters
Each step features a question mark icon (?) next to its header; clicking these icons provides helpful explanations directly within the toolbar.
Climate Selection
The download process begin by configuring the type of climate data you need using the upper sections of the Sustax Toolbar. The “Climate Selection” panel contains sub components of “Climate variable,” “Data frequency,” “Data Sets”, and “Climate Change Scenario” selectors / drop down menus.
1. Climate Variable
In the ‘Climate variable’ option, you can activate one or more core climate variables (any combination) by checking the boxes next to them:
- Temperature at Surface (tas)
- Maximum Wind Speed (sfcWindmax)
- Total Precipitation (pr)
- …
During the data selection process, the ‘Total selected’ indicator will update as you make your choices. This number reflects the unique combinations of variable-frequency-scenario that will be generated. For this tutorial, let’s begin by selecting only Temperature at Surface (tas). Later, we’ll explore selecting multiple variables.
Once a “Climate variable” is selected, a random map showcasing real climate change impacts will be generated
2. Data Frequency
Next, choose the ‘Data frequency(ies)’ you need. Click on ‘Daily’, ‘Metrics’, or ‘Monthly’ to activate or deactivate them. You can select multiple frequencies.
- Daily: For daily climate data values (e.g., daily average temperature, daily total precipitation) and their model spread.
- Monthly: For monthly aggregated data or derived monthly climate indices (e.g., Cooling Degree Days, Monthly Maximum Wind Gust).
- Metrics: For statistical accuracy indicators (e.g., MAE, Pearson R) showing our model performance against historical data for the selected climate variable(s).
For this first part of our example, let’s activate only ‘Monthly’
3. Data Sets
Now, click into the ‘Data sets’ checklist dropdown. Because we currently have only Temperature at Surface (tas) and ‘Monthly’ frequency active, this list will display all available monthly climate indices derived from tas (e.g., CDD, GDD, AvMT). Select one or more indices by checking the boxes. For this example, let’s check (tas – Monthly) – (CDD) Cooling Degree Days.
You can scroll through this list or use the ‘Search data sets’ bar at the top of the dropdown to quickly find a specific index. The ‘Total selected’ count (reflecting individual data products) will update.
4. Climate Change Scenarios
Finally, click the “Climate change scenarios” dropdown. Note that, automatically, all climate change scenarios are selected, except for the scenario ERA5, corresponding to the historical model ERA5
- Select / unselect one or more SSP-RCP scenarios for your analysis (e.g., SSP2-4.5, SSP5-8.5).
- Note that for each daily, monthly variable and even metric you can select the scenarios that you wish to retrieve data for.
- Successful selection of scenarios results in the scenarios being shown in the field after the popup menu closes.
Multiple Climate Variable selection
Sustax allows you to build a comprehensive data request by selecting multiple climate variables and data frequencies simultaneously. Let’s modify our selections:
- In the ‘Climate variable’ section, in addition to tas, also check Maximum Wind Speed (sfcWindmax).
- In the ‘Data frequency’ section, in addition to ‘Monthly’, also activate ‘Daily’ and ‘Metrics’.”
Now, click into the ‘Data sets’ checklist dropdown again. Notice that the list is now much more extensive. It contains:
- Daily options for tas (e.g., (tas – Daily) – (tas) 2 Metre Temperature, (tas – Daily) – (tas) Models Spread).
- Metrics for tas (e.g., (tas – Metrics) – (MAE) Mean Absolute Error).
- Monthly indices for tas (like our previously selected CDD).
- Daily options for sfcWindmax.
- Metrics for sfcWindmax
- Monthly indices for sfcWindmax.
This dynamic list allows you to pick and choose exactly which data products you need across your selected variables and frequencies in one go. For our tutorial, let’s add the following to our selection:
- From the Temperature at Surface (tas) group:
- (tas – Daily) – (tas) 2 Metre Temperature
- From the Maximum Wind Speed (sfcWindmax) group:
- (sfcWindmax – Monthly) – (fxx) Maximum Wind Gust
- (sfcWindmax – Metrics) – (EngD) Energy Distance
Use the ‘Search data sets’ bar if needed. Check the boxes for these items. Your ‘Total selected’ count should update accordingly.
After making your selections in these initial fields, you may need to click a “Continue” button (visible in the screenshot below “Climate change scenarios” and above “Geographic Selection”) to proceed or to activate the next sections of the toolbar.
Geographic Selection
Now that you have specified what climate data you want, you will define where.
The “Geographic Selection” section of the Toolbar allows you to define your location of interest. Sustax enables 2 different graphical methods of selection via the map, besides a text based point selection (postal codes, streets, cities and regions), and a WGS84 coordinates selection (i.e., typing WGS84 latitude and longitude, comma separated).
As shown in the illustration above, the “Geographic Selection” section is organized into three distinct tools. Users can freely choose the method that best suits the selection of their area or point of interest. Every time a geographical selection is made, the coordinates in the lower-left corner of the map update automatically and become fixed to reflect the current choice.
Interactive Selection
- Point Selection: Placing the marker on the map will cause the Sustax backend to identify the pixel of data that is relevant to your query
- Area Selection: Placing a rectangle selector will cause the Sustax backend to select ALL pixels that are relevant to your query. Note that this can cause a significant amount of data to be requested (and a corresponding high cost to process the query)
Search Bar Selection
- Text Selection: You may enter any street address, postal code, city, or region into the search bar. Sustax automatically displays matched alternatives in a dropdown menu; selecting one fixes the coordinates both in the Sustax system and on the map’s coordinate panel. As an example, typing “08036” will show options from Italy, Spain, or the US with that postal code.
- WGS84 coordinates: Alternatively, you can enter WGS84 coordinates directly, such as “25,25”. After being automatically prompted in the dropdown (i.e.; “coordinates: 25,25”) selecting these coordinates will pinpoint the exact spot (confirmed in the bottom left of Sustax’s interface), for instance, the southern border between Egypt and Libya.
Years Selection
The final step is to specify the climate data years range. Use the “Years Selection” feature to from what year to what other year should the climate data be delivered , both years are included in the output.
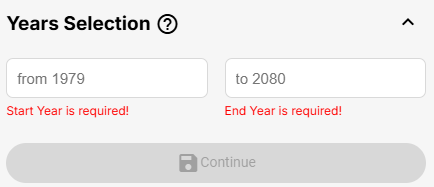
The years available in Sustax span from 1979 to 2080 (both included). Select your preferred time frame with the provided selectors
To proceed, click “Continue” and check the tick-box below to accept the Sustax Disclaimer before finalising your climate data request. This will prompt a pre-request step, where you can visualize your request details, see the estimated price, and adjust any parameters as needed before confirmation.
Visualising the Request Price
Once you agreed to the Sustax disclaimer and clicked on “Generate Request” button (only activates if all necessary fields have been filled and saved), a spinner will appear, followed by a window to summarise the data you have requested, along with the price in Sustax coins.
The Request Summary will show the selected coordinates, a breakdown of climate variables by scenario and by locations, estimating the total Sustax coin cost. Please, review this carefully before clicking ‘Confirm’. Remember that the cost of the data in Sustax coins is a function of the number of datasets, scenarios, locations, and years being requested.