Interactive Index
- The CSV Output File
- Import Data with M. Excel
- Import Data with Python
- Import Data with R
- Importing and Interpreting with Large Language Models
- Sustax User’s API (SUA)
- Code to Access Sustax API
The CSV Output File
Each Sustax request will return 1 CSV file per gridcell or POI (Point of Interest), encoded in UTF-8, with fields separated by commas. If the user ask for monthly data and daily data in the same request, it gets 2 CSV files. Each CSV consists of three main structures:
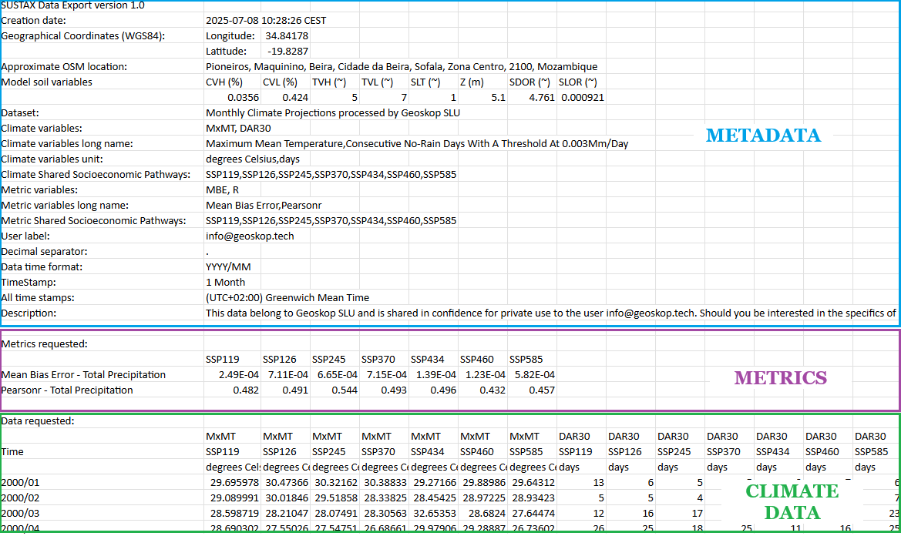
1. Metadata (free of cost)
Includes the CSV creation date, a precise location in geographical coordinates (WGS84), an approximate Open Street Map location, the climate variables requested (short name, long name and units), the accuracy metrics requested (short name and long name) and the scenarios requested (SSPs or ERA5). Each requests also includes free of cost a set of static variables representing the interpreted geophysical features of the gridcell, which includes:
- CVH. Estimated high cover vegetation fraction (%)
- CVL. Estimated low cover vegetation fraction (%)
- TVH. Type of high vegetation (~)
- TVL. Type of low vegetation (~)
- SLT. Soil type (~)
- Z. Estimated geopotential height, (m)
- SDOR. Standard deviation of sub-gridscale orography, (~)
- SLOR. Slope of sub-gridscale orography, (~)
2. Accuracy metrics (payload)
The predictive accuracy metrics have a key characteristic: they are timeless, meaning there are 5 metrics with a single value for each climate variable and each SSP-RCP scenario.
3. Climate Data (payload)
The climate data consist of time series, which can be at daily or monthly resolution. For each climate scenario and variable, a time series is generated that can contain up to 102 years of data. Since users can request data with monthly or daily time stamps. Two separate CSVs are generated if the user’s request includes datasets with both temporal resolutions.
If the user requests an ROI (Region of Interest) instead of a POI (Point of Interest), it will receive multiple CSVs—one for each POI contained within the requested ROI. In any case, the requested CSV(s) are delivered in a compressed ZIP file.
Import Data with M. Excel
As Sustax’s CSV encoding uses UTF-8 with BOM, Excel usually detects it automatically.
Desktop Excel
- Open Excel (desktop version).
- Go to Data → Get Data → From Text/CSV.
- Select your CSV file and click Import.
- In the Import Wizard:
- File Origin: Choose 65001: Unicode (UTF-8).
- Delimiter: Select Comma (,).
- Click Load (or Transform Data if you want to edit in Power Query).
- Your data will appear in separate columns.
Online Excel
- Upload the CSV to OneDrive.
- Open it in Excel Online.
- If Excel detects the delimiter automatically, it will split columns.
- If not, select the entire Text Column:
- Click on Data tab
- On Data Tools, click on Split Text to Columns, consider the delimiter is a comma (,).
If you see strange characters in the metadata (e.g., ñ, accents, foreign ANSI characters), ensure you selected UTF-8 in the import system. If your Excel is not formatted with dots ‘.’ as decimal separator, the data will be wrongly displayed (e.g. Spanish Excels and the ‘,’ as decimal separator)
Import Data with Python
It requires Python 3.6 or above with two external libraries:
- Numpy
- Pandas
The script contains a single function with all the imports necessary inside.
import csv
import decimal
import numpy as np
import pandas as pd
from datetime import datetime

def load_sustax_file(csv_stx, return_pandas_df = True, return_metadata = False):
    """
    Pull Sustax CSV data to Python's IDE as numpy arrays or as panda dataframes

    Parameters:
    ----------
        - csv_stx: Str. or Path obj. Full file name pointing to Sustax CSV
        - return_pandas_df: Bool. Use bool(True) to get outputs as Pandas obj.
        - return_metadata: Bool. Use bool(True) to get CSV metadata

    Returns:
    -------
        Returns two, three or four objects depending on `return_pandas_df` and
        `return_metadata` parameters:
            1. Climate data: All `Data requested` field from the CSV file
            2. Accuracy metrics: All `Metrics requested` field from the CSV file
            3. Climate data Time Stamps: All timesteps in `Data requested` field
            4. Metadata: Dictionary object containg all the CSV metadata
        The climate data and accuracy metrics can be returned as dictionaries
        with arrays or as Pandas dataframe
        If `return_pandas_df` is requested, Time Stamps are merged with the
        climate data automatically

    External packages required:
    --------------------------
        - Numpy
        - Pandas
    """
    def _isfloat(string):
        try:
            decimal.Decimal(string)
            return True
        except decimal.InvalidOperation:
            return False

    with open(csv_stx, 'r', encoding = None) as fobj:
        data = csv.reader(fobj, delimiter = ',')
        data = [i for i in data]
    if return_metadata:
        mt = {}
        mt["creation_date"] = data[1][1]
        mt["OSM_approximate_location"] = data[4][1]
        for r in data:
            if any(['longitude' in h.lower() for h in r]):
                mt["lon"] = [float(rr) for rr in r if _isfloat(rr)][0]
            if any(['latitude' in h.lower() for h in r]):
                mt["lat"] = [float(rr) for rr in r if _isfloat(rr)][0]
            if any(['soil variables' in h.lower() for h in r]):
                idx_loc = [c for c in range(len(data)) if 'Soil variables:' in data[c]][0]
                mt["soil_data"] = {}
                for c in range(1, len(r)):
                    if r[c]:
                        mt["soil_data"].update({data[idx_loc][c]:data[idx_loc+1][c]})

    # Check if daily or monthly dataset, get the whole string
    dts_type = [d for d in data if (len(d) > 0) and (d[0] == 'Dataset:')][0][1]
    # Get climate data
    # Four rows below to get the metric values
    idx_data = [c for c in range(len(data))\
                if 'Data requested:' in data[c]][0] + 4
    all_data = data[idx_data:]
    all_data_vars = data[idx_data-3]
    all_data_scenarios = data[idx_data-2]
    if return_metadata:
        mt["var_us"] = [r for r in data[idx_data-1] if r]
        mt["var_scs"] = [r for r in data[idx_data-2] if r and (r.lower() != 'time')]
        mt["var_nm"] = [r.split('-')[0] for r in data[idx_data-3] if r]
        try:
            # In this case returns the unique long name
            idx_long = [c for c in range(len(data)) if 'Climate variables long name:' in data[c]][0]
            mt["var_l_nm"] = data[idx_long][1].split(',')
        except (IndexError, TypeError):
            pass
    # Get metrics data
    if [d for d in data if (len(d) > 0) and\
                           ('Metric variables:' in d)][0][1] != '':
        # Two rows below to get the metric values
        # Five row up to get to the last metric
        idx_metrics = [c for c in range(len(data))\
                       if 'Metrics requested:' in data[c]][0] + 2
        all_metrics = data[idx_metrics:idx_data - 5]
    else:
        all_metrics = {}
    dt_metrics = {}
    for r in all_metrics:
        metric_nm = r[0].split(' - ')[0]
        var_nm = r[0].split(' - ')[1]
        if var_nm not in dt_metrics:
            dt_metrics.update({var_nm:{}})
        dt_metrics[var_nm].update({metric_nm:{}})
        for c in range(1, len(r)):
            if _isfloat(r[c]):
                dt_metrics[var_nm][metric_nm][all_data_scenarios[c]] = float(r[c])

    # Get climate payload data
    dt = {}
    for c in range(len(all_data_vars)):
        if all_data_vars[c] != '':
            dt.setdefault(all_data_vars[c],{}).update({all_data_scenarios[c]:[]})

    # Load all data to local variables
    time = []
    for r in all_data:
        for c in range(len(r)):
            if ("SSP" in all_data_scenarios[c]) or ("ERA" in all_data_scenarios[c]):
                dt[all_data_vars[c]][all_data_scenarios[c]].append(float(r[c]) if r[c]!='' else float('NaN'))
        time.append(datetime.strptime(r[0], '%Y/%m' if 'monthly' in dts_type.lower()\
                                                    else "%Y/%m/%d"))
    # Payload data to array
    time = np.array(time, dtype = f'datetime64[{"M" if "monthly" in dts_type.lower() else "D"}]')
    dt = {k: {s: np.asarray(dt[k][s]) for s in dt[k]} for k in dt}
    if return_pandas_df:
        all_dfs = [pd.Series({d: v for d, v in zip(time, dt[var][s])}).to_frame(name = f"{var} [{s}]")\
                   for var in dt for s in dt[var]]
        df_vals = all_dfs[0].join(all_dfs[1:])
        # Return empty DF if no metrics
        all_dfs = [pd.Series({v: dt_metrics[var][s][v] for v in dt_metrics[var][s]}).to_frame(name = f"{var} [{s}]")\
                   for var in dt_metrics for s in dt_metrics[var]]
        # Avoid empty metrics if csv does not contain them
        df_metrics = all_dfs[0].join(all_dfs[1:]) if all_dfs else pd.DataFrame()

        if return_metadata:
            return df_vals, df_metrics, mt
        else:
            return df_vals, df_metrics
    else:
        if return_metadata:
            return dt, dt_metrics, time, mt
        else:
            return dt, dt_metrics, time
Import Data with R
The code below requires R 4.4.1. or above:
load_sustax_file <- function(csv_stx, return_metadata = FALSE) {
  #' Load Sustax CSV

  is_float <- function(x) {
    !is.na(suppressWarnings(as.numeric(x))) && nchar(trimws(x)) > 0
  }

  # Read all lines
  con <- file(csv_stx, "r", encoding = "UTF-8")
  lines <- readLines(con, warn = FALSE)
  close(con)

  # Parse CSV rows
  data <- lapply(lines, function(line) {
    con_line <- textConnection(line)
    parsed <- tryCatch({
      as.character(read.csv(con_line, header = FALSE, stringsAsFactors = FALSE,
                           check.names = FALSE, na.strings = NULL)[1, ])
    }, error = function(e) strsplit(line, ",")[[1]])
    close(con_line)
    return(parsed)
  })

  # === EXTRACT METADATA ===
  if (return_metadata) {
    mt <- list()

    for (i in seq_along(data)) {
      r <- data[[i]]

      if (i == 2 && length(r) >= 2) {
        mt$creation_date <- r[2]
      }

      if (i == 5 && length(r) >= 2) {
        mt$OSM_approximate_location <- r[2]
      }

      if (any(grepl("longitude", r, ignore.case = TRUE))) {
        nums <- suppressWarnings(as.numeric(r))
        nums <- nums[!is.na(nums)]
        if (length(nums) > 0) mt$lon <- nums[1]
      }

      if (any(grepl("latitude", r, ignore.case = TRUE))) {
        nums <- suppressWarnings(as.numeric(r))
        nums <- nums[!is.na(nums)]
        if (length(nums) > 0) mt$lat <- nums[1]
      }

      if (any(grepl("soil variables", r, ignore.case = TRUE))) {
        idx_loc <- which(sapply(data, function(x) any(grepl("^Soil variables:", x))))[1]
        if (!is.na(idx_loc) && idx_loc < length(data)) {
          soil_header <- data[[idx_loc]]
          soil_values <- data[[idx_loc + 1]]
          mt$soil_data <- list()
          for (c in 2:length(soil_header)) {
            if (c <= length(soil_values) &&
                nchar(trimws(soil_header[c])) > 0 &&
                nchar(trimws(soil_values[c])) > 0) {
              mt$soil_data[[soil_header[c]]] <- soil_values[c]
            }
          }
        }
      }
    }
  }

  # Dataset type
  dts_type <- ""
  for (d in data) {
    if (length(d) > 0 && d[1] == "Dataset:") {
      dts_type <- d[2]
      break
    }
  }

  # === CHECK IF DATA REQUESTED EXISTS ===
  idx_data_check <- which(sapply(data, function(x) any(grepl("^Data requested:", x))))

  if (length(idx_data_check) == 0 || is.na(idx_data_check[1])) {
    df_vals <- data.frame(Time = as.Date(character(0)))
    all_data_vars <- character(0)
    all_data_scenarios <- character(0)
    all_data_units <- character(0)
  } else {
    idx_data <- idx_data_check[1] + 4
    all_data_vars <- data[[idx_data - 3]]
    all_data_scenarios <- data[[idx_data - 2]]
    all_data_units <- data[[idx_data - 1]]

    if (return_metadata) {
      mt$var_us <- all_data_units[nchar(trimws(all_data_units)) > 0]
      mt$var_scs <- all_data_scenarios[nchar(trimws(all_data_scenarios)) > 0 &
                                       tolower(all_data_scenarios) != "time"]
      mt$var_nm <- sapply(all_data_vars[nchar(trimws(all_data_vars)) > 0], function(x) {
        if (grepl("-", x, fixed = TRUE)) strsplit(x, "-", fixed = TRUE)[[1]][1] else x
      }, USE.NAMES = FALSE)

      idx_long <- which(sapply(data, function(x)
        length(x) > 0 && any(grepl("Climate variables long name:", x))))[1]
      if (!is.na(idx_long)) {
        long_str <- paste(data[[idx_long]][-1], collapse = ",")
        long_str <- gsub('"', '', long_str)
        mt$var_l_nm <- strsplit(long_str, ",")[[1]]
      }
    }

    # === PARSE CLIMATE DATA ===
    dt <- list()
    col_info <- list()

    for (c in seq_along(all_data_vars)) {
      var_name <- all_data_vars[c]
      scenario <- all_data_scenarios[c]

      if (nchar(trimws(var_name)) > 0 &&
          nchar(trimws(scenario)) > 0 &&
          (grepl("SSP", scenario) || grepl("ERA", scenario) || grepl("RAS", scenario))) {

        key <- paste0(var_name, "_", scenario)
        dt[[key]] <- numeric(0)
        col_info[[key]] <- list(variable = var_name, scenario = scenario)
      }
    }

    all_data <- data[idx_data:length(data)]
    time <- character(0)
    is_monthly <- grepl("monthly", dts_type, ignore.case = TRUE)

    for (r in all_data) {
      if (length(r) > 0 && nchar(trimws(r[1])) > 0) {
        time <- c(time, r[1])

        for (c in 2:length(r)) {
          if (c <= length(all_data_scenarios) && c <= length(all_data_vars)) {
            var_name <- all_data_vars[c]
            scenario <- all_data_scenarios[c]

            if (nchar(trimws(var_name)) > 0 &&
                nchar(trimws(scenario)) > 0 &&
                (grepl("SSP", scenario) || grepl("ERA", scenario) || grepl("RAS", scenario))) {

              key <- paste0(var_name, "_", scenario)
              value <- ifelse(nchar(trimws(r[c])) > 0,
                            suppressWarnings(as.numeric(r[c])),
                            NA_real_)

              if (key %in% names(dt)) {
                dt[[key]] <- c(dt[[key]], value)
              }
            }
          }
        }
      }
    }

    if (is_monthly) {
      time_parsed <- as.Date(paste0(time, "/01"), format = "%Y/%m/%d")
    } else {
      time_parsed <- as.Date(time, format = "%Y/%m/%d")
    }

    if (length(dt) > 0) {
      df_list <- list(Time = time_parsed)

      for (key in names(dt)) {
        full_var <- col_info[[key]]$variable
        if (grepl("-", full_var, fixed = TRUE)) {
          short_var <- strsplit(full_var, "-", fixed = TRUE)[[1]][1]
        } else {
          short_var <- full_var
        }
        scenario <- col_info[[key]]$scenario

        col_name <- paste0(short_var, " [", scenario, "]")
        df_list[[col_name]] <- dt[[key]]
      }

      df_vals <- as.data.frame(df_list, stringsAsFactors = FALSE)
    } else {
      df_vals <- data.frame(Time = time_parsed)
    }
  }

  # === PARSE METRICS (BUG FIX HERE!) ===
  metric_var_idx <- which(sapply(data, function(x)
    length(x) > 0 && any(grepl("^Metric variables:", x))))[1]

  has_metrics <- FALSE
  if (!is.na(metric_var_idx)) {
    metric_check <- data[[metric_var_idx]]
    if (length(metric_check) > 1 && nchar(trimws(metric_check[2])) > 0) {
      has_metrics <- TRUE
    }
  }

  dt_metrics <- list()
  metrics_col_info <- list()

    if (has_metrics) {
      idx_metrics_check <- which(sapply(data, function(x)
        any(grepl("^Metrics requested:", x))))

      if (length(idx_metrics_check) > 0) {
        idx_metrics <- idx_metrics_check[1] + 2

        # DYNAMIC: Scan until we find a row that's NOT a metric
        idx_metrics_end <- idx_metrics - 1  # Start before first metric

        for (i in idx_metrics:length(data)) {
          r <- data[[i]]
          # Stop if empty row OR doesn't contain " - " pattern
          if (length(r) == 0 || nchar(trimws(r[1])) == 0 || !grepl(" - ", r[1], fixed = TRUE)) {
            break
          }
          idx_metrics_end <- i  # This row is a valid metric
        }

        if (idx_metrics <= idx_metrics_end) {
          all_metrics <- data[idx_metrics:idx_metrics_end]
          metrics_header_row <- data[[idx_metrics - 1]]

          for (r in all_metrics) {
            if (length(r) > 0 && nchar(trimws(r[1])) > 0 && grepl(" - ", r[1], fixed = TRUE)) {
              parts <- strsplit(r[1], " - ", fixed = TRUE)[[1]]
              metric_nm <- parts[1]
              var_nm <- parts[2]

              key <- paste0(var_nm, "_", metric_nm)
              dt_metrics[[key]] <- list()
              metrics_col_info[[key]] <- list(variable = var_nm, metric = metric_nm)

              for (c in 2:length(r)) {
                if (c <= length(metrics_header_row) && is_float(r[c])) {
                  scenario <- metrics_header_row[c]
                  if (nchar(trimws(scenario)) > 0) {
                    dt_metrics[[key]][[scenario]] <- as.numeric(r[c])
                  }
                }
              }
            }
          }
        }
      }
    }
  # Build METRICS dataframe
  if (length(dt_metrics) > 0) {
    all_scenarios <- unique(unlist(lapply(dt_metrics, names)))
    metrics_df_list <- list()

    for (key in names(dt_metrics)) {
      var_nm <- metrics_col_info[[key]]$variable
      metric_nm <- metrics_col_info[[key]]$metric

      col_name <- paste0(var_nm, " [", metric_nm, "]")

      values <- sapply(all_scenarios, function(sc) {
        if (sc %in% names(dt_metrics[[key]])) {
          dt_metrics[[key]][[sc]]
        } else {
          NA_real_
        }
      })

      metrics_df_list[[col_name]] <- values
    }

    df_metrics <- as.data.frame(metrics_df_list, stringsAsFactors = FALSE)
    rownames(df_metrics) <- all_scenarios
  } else {
    df_metrics <- data.frame()
  }

  if (return_metadata) {
    return(list(climate_data = df_vals, accuracy_metrics = df_metrics, metadata = mt))
  } else {
    return(list(climate_data = df_vals, accuracy_metrics = df_metrics))
  }
}
Importing and Interpreting with Large Language Models
Sustax climate data is delivered in structured CSV files containing metadata, accuracy metrics, and time-series data. Effectively interpreting this data with large language models (LLMs) relies on not only importing but also understanding the structure and content.
LLMs excel at automating the interpretation of diverse data sections by generating parsing and cleaning code and providing initial analyses or summaries. This greatly reduces manual data preparation and error risks, making climate risk assessment more efficient.
To facilitate meaningful interpretation:
- Provide the LLM with context by granting access to the Sustax Documentation Hub before processing data.
- There are two alternative to use so that the LLM can interpret the CSV file:
- For textual context: Split CSV files into manageable parts: (1) metadata as plain text to preserve descriptive context (i.e., metadata.txt), and (2) accuracy metrics and (3) time-series sections as tabular CSVs (i.e., accuracy_metrics.csv, climate_timeseries_data.csv) to maintain structure.
- For analytical context: Copy the official loader function from Sustax's Documentation Hub (right above). You can paste the copied function directly into the LLM prompt as text, the Generative AI system will interpret and gain immediate access to clean data structures for aggregation, plotting, or model evaluation. This way you will not need to split the original Sustax CSV.
- Test the understanding of the data by the LLM by asking questions like "Where is this data from?", "What period of data is included in the time series?"
- Use summarised or monthly data extracts over more extense daily data when possible, as LLMs process text via prompts or integrated tools rather than directly ingesting files.
To optimise the request of information, you better use monthly data instead of daily as LLM models don't directly "ingest" files—they process text via prompts, APIs, or integrated tools (e.g., Python code execution).
Best practices
- Prompt Engineering: Always include context, e.g., "Here is accuracy_metrics.csv content: [paste or upload]. Generate Python code to load and visualize it."
- Tools Integration: Use LLMs with file-handling plugins (e.g., ChatGPT Advanced Data Analysis) to upload CSVs directly.
- Testing: Validate splits ensure no data loss (e.g., row counts match). If using APIs, base64-encode files for transmission.
- Security Note: Avoid sharing sensitive data; anonymize if needed.
Sustax User API
The Sustax User's API (SUA) is a programmatic interface designed for accessing and downloading climate data from the Sustax platform by command line. It enables users to retrieve any Sustax dataset using (1) point-of-interest (POI) coordinates (WGS84 lat/lon), (2) bounding boxes (ROI), or (3) postal codes. This API is particularly useful for developers, researchers, and organisations needing automated, bulk access to Sustax's models for applications like risk assessment, adaptation planning, or integration into custom tools.
The API uses token-based auth and generates direct download URLs with the dataset (which you will also receive on your account email and Sustax's dashboard). We also offer a Python's User API including authentication, up-to-date data catalogue, price checks, purchases, downloads and much more!
Step 1. Authentication: Obtain a Secret User Token
This token authenticates subsequent requests and ensures secure access to your account's data entitlements.
- Input: Provide your username and password in a POST request
- Output: If successful, the API returns a user_token
- Endpoint: https://app.sustax.earth/api
Step 2. Access Sustax Data Catalogue
View all available datasets and their associated unique ID to determine which data products you can purchase or request.
- Input: Send a GET request containing your valid user_token in the authorization header.
- Output: If successful, the API returns a JSON list describing all available datasets (e.g., dataset name, ID, dates, variables).
- Endpoint: https://app.sustax.earth/api/getData
Step 3. Submit Data Request
Before making a data request, users must obtain a datasets unique ID (e.g., for Shared Socioeconomic Pathways like SSP1-1.9 or SSP5-8.5). These Sustax codes are available using the Sustax data catalogue function from the previous step.
There are 3 different ways to geolocate your area of interest.
-
Point of Interest (POI): By passing a latitude and a longitude (as floats), as WGS84 coordinates
{"lat": -19.828707, "lon": 34.841782} -
Region of Interest (ROI): Define a square by passing [min latitude (S), max latitude (N)] and [min longitude (W), max longitude (E)] as WGS84 coordinates
{"lat": N, "lon": W, "lat2": S, "lon2":E} -
Postal Code + Country: POI equivalent defined by Postal Code and Country (ISO 3166-1 alpha-2) that invokes Nominatim API
{"postal_code": "08001", "country": "ES"}
No manual "pre-request" validation is needed; the system proceeds automatically to generate a request. Be careful with the pricing! (An API endpoint for a price request is available in the Additional API Endpoints section)
- Input: Provide the following parameters
- lat: Latitude coordinate (WGS84 format, e.g., -19.828707 for a location in Mozambique for POIs or a list [min_lat, max_lat] for ROIs).
- lon: Longitude coordinate (WGS84 format, e.g., 34.841782 for POIs or a list [min_lon, max_lon] for ROIs).
- first_year: Starting year for the data range (e.g., 2000).
- last_year: Ending year for the data range (e.g., 2080).
- Sustax ID code/s: The Sustax dataset ID(s) (e.g., for a specific SSP-RCP combination(s) and variable(s)).
- Postal code: (Optional) Postal code (string, e.g., "08001" for Barcelona)
- Country: (Optional) ISO 3166-1 alpha-2 country code (required if postal_code is provided, e.g., "ES" for Spain)
- Disclaimer Acceptance: The Sustax disclaimer must be accepted (pass true) before buying any data. The disclaimer is available here: Sustax API User Disclaimer
- Output: If successful, returns a response code of "200" with a request_url (a direct link to download the data, such as a Zip file containing as many CSV's as POI's requested and a request_message (any status notes).
- Endpoint: https://app.sustax.earth/api/buyData
Downloads may take anywhere from 10 seconds to 5 minutes. Please note that the connection with Sustax will time out after 30 minutes. Regardless of the timeout, the downloaded file URL will be sent directly to the email address associated with your Sustax account. You can use this URL to continue accessing the API.
Step 4: Download the purchased zip file
After completing a purchase, use the provided download URL to fetch your data package
- Input: Send a GET request to the supplied download link (download_url) while including your user_token in the header. Specify a local directory on your computer to save the ZIP file.
- Output: If successful, the file will be saved to your chosen download directory.
Step 5: Unzip the downloaded zip file
Extract the contents of the downloaded ZIP file.
- Input: Provide the local path to the downloaded ZIP file. No API request is required (local operation only).
- Output: Upon successful extraction, you will have access to the CSV files containing all the requested datasets.
The data is exported in Sustax CSV standard format (as seen in sample exports), containing headers for climate variables (e.g., Maximum Mean Temperature, Consecutive No-Rain Days), units, scenarios, and metrics. It includes timestamps, geographical details.
Additional API Endpoints
- Get a Price Quote
- Input: Provide the following parameters
- lat: Latitude coordinate (WGS84 format, e.g., -19.828707 for a location in Mozambique for POIs or a list [min_lat, max_lat] for ROIs).
- lon: Longitude coordinate (WGS84 format, e.g., 34.841782 for POIs or a list [min_lon, max_lon] for ROIs).
- first_year: Starting year for the data range (e.g., 2000).
- last_year: Ending year for the data range (e.g., 2080).
- Sustax code: The Sustax dataset ID(s) (e.g., for a specific SSP-RCP combination(s) and variable(s)).
- Postal code: (Optional) Postal code (string, e.g., "08001" for Barcelona)
- Country: (Optional) ISO 3166-1 alpha-2 country code (required if postal_code is provided, e.g., "ES" for Spain)
- Output: If successful, the API returns a JSON list describing the price of the requested Sustax datasets and pre-request information.
- Endpoint: https://app.sustax.earth/api/viewPriceRequest
- Input: Provide the following parameters
- Check Request Status
- Input: Request ID
- Output: If successful, the API returns the status of your current request
- Endpoint: https://app.sustax.earth/api/viewRequestState/{request_ID}
- Get Account's Credits
- Input: -
- Output: If authenticated returns the available user's Sustax credits
- Endpoint: https://app.sustax.earth/api/getUserCoins
- Get Sustax Coordinates
- Input: Latitude and longitude
- Output: Correspoding coordinates in Sustax
- Endpoint: https://app.sustax.earth/api/getCoordinates
Code to Access Sustax API
The code below requires python 3.9 or above:
import re
import zipfile
import requests
from pathlib import Path
from functools import wraps
from urllib3.util.retry import Retry
from requests.adapters import HTTPAdapter
from typing import Any, Dict, List, Tuple, Optional, Union

class SustaxClient:
    """
    Client for SUA, the Sustax User API (https://app.sustax.earth) with
    automatic authentication and token refresh on expiry.

    Public methods:
    -------------
        - authenticate(username, password, remember_me=True) -> str
                              Authenticate and return JWT token.
        - get_variables_id() -> Dict
                              Get full catalog of datasets and scenarios (use for sustax_code_ids).
        - view_price_request(lat, lon, year_from, year_to, sustax_code_ids, postal_code, country) -> Dict
                              Get price quote before buying (supports POI/ROI/postal).
        - buy_data(lat, lon, year_from, year_to, sustax_code_ids, postal_code, country) -> Dict
                              Purchase data and return request details (supports POI/ROI/postal).
        - download_file(url, dest_dir, chunk_size, mk_parents, exist_ok) -> Path
                              Stream-download ZIP to dest_dir.
        - unzip_download(dest_dir) -> Path
                              Unzip self.dest (last download) to dest_dir.
        - get_coordinates(lat, lon) -> Dict
                              Get nearest pixel coords for POI.
        - view_request_state(request_id) -> Dict
                              Poll buy_data request status.
        - get_user_coints() -> Int
                              Returns amount of coins the user owns in Sustax

    Usage:
    -----
      >>> with SustaxClient() as SUA:
      >>>     SUA.authenticate("user", "pass")
      >>>     ids = SUA.get_variables_id()["climateVariable"]  # Get dataset IDs
      >>>     price = SUA.view_price_request(lat=41.4, lon=2.1, sustax_code_ids=ids)
      >>>     req = SUA.buy_data(lat=41.4, lon=2.1, sustax_code_ids=ids[:2])
      >>>     #Check req["requestId"] with SUA.view_request_state
      >>>     SUA.download_file(req['url'], "directory")
      >>>     SUA.unzip_download("directory")
      >>> #Use stx_csv_load() to load your csv from here
    """

    def __init__(self, base_url: str = "https://app.sustax.earth",
                 timeout: Union[float, Tuple[float, float]] = (30, 300)) -> None:
        self.base_url = base_url.rstrip("/")
        self.timeout = timeout
        self.session_get = requests.Session()
        self.session_post = requests.Session()
        for s in (self.session_get, self.session_post):
            s.headers.update({"Accept": "application/json"})

        # Retry on DNS/connection failures - Two adapters GET & POST
        retry_get = Retry(
            total=5, connect=3, read=3, status=5, other=0,
            backoff_factor = 2., backoff_max=120, backoff_jitter=.5,
            status_forcelist=(429, 500, 502, 503, 504),
            allowed_methods=frozenset({"GET", "HEAD", "OPTIONS"}),
            respect_retry_after_header=True,
        )
        self.session_get.mount("https://", HTTPAdapter(max_retries=retry_get))
        self.session_get.mount("http://", HTTPAdapter(max_retries=retry_get))
        retry_post = Retry(
            total=3, connect=3, read=0, status=0, other=0, redirect=0,
            backoff_factor = 1, backoff_max=30,
            allowed_methods=frozenset({"POST"}),
            respect_retry_after_header=True,
        )
        self.session_post.mount("https://", HTTPAdapter(max_retries=retry_post))
        self.session_post.mount("http://", HTTPAdapter(max_retries=retry_post))

        self._token: Optional[str] = None
        self._username: Optional[str] = None
        self._password: Optional[str] = None
        self._remember_me: bool = True
        self._creds_ok: bool = False
        self.dest: Optional[Path] = None

    # ---------------------- authentication checking ----------------------

    @staticmethod
    def _require_auth(func):
        """Decorator to ensure authentication before API calls."""
        @wraps(func)
        def wrapper(self, *args, **kwargs):
            if not self._token:
                raise RuntimeError(
                    f"Authentication required. Call authenticate() before using {func.__name__}()."
                )
            return func(self, *args, **kwargs)
        return wrapper

    def _reauth_if_possible(self) -> str:
        """Re-authenticate using stored credentials."""
        if self._username and self._password:
            return self.authenticate(self._username, self._password, self._remember_me)
        raise RuntimeError("Token expired and no stored credentials to re-authenticate.")

    def close(self) -> None:
        self.session_get.close()
        self.session_post.close()

    def __enter__(self) -> "SustaxClient":
        return self

    def __exit__(self, exc_type, exc, tb) -> None:
        self.close()

    # ---------------------- internal helpers ----------------------

    def _authorized_post(self, url: str, **kwargs) -> requests.Response:
        """POST with automatic one-time re-auth on 401."""
        headers = kwargs.pop("headers", {})
        headers = {**self.session_post.headers, "Content-Type": "application/json", **headers}
        timeout = kwargs.pop("timeout", self.timeout)
        resp = self.session_post.post(url, headers=headers, timeout=timeout, **kwargs)
        if (resp.status_code == 401) and self._creds_ok:
            self._reauth_if_possible()
            resp = self.session_post.post(url, headers=headers, timeout=timeout, **kwargs)
        resp.raise_for_status()
        return resp

    def _authorized_get(self, url: str, **kwargs) -> requests.Response:
        """GET with automatic one-time re-auth on 401."""
        timeout = kwargs.pop("timeout", self.timeout)
        resp = self.session_get.get(url, timeout=timeout, **kwargs)
        if (resp.status_code == 401) and self._creds_ok:
            self._reauth_if_possible()
            resp = self.session_get.get(url, timeout=timeout, **kwargs)
        resp.raise_for_status()
        return resp

    def _build_location_payload(self,*,lat: Optional[Union[int,float,str,list,tuple]] = None,
                                       lon: Optional[Union[int,float,str,list,tuple]] = None,
                                       postal_code: Optional[str] = None,
                                       country: Optional[str] = None,) -> Dict[str, Any]:
        # Decide which location method to use
        has_poi = isinstance(lat, (int,float,str)) and isinstance(lon, (int,float,str))
        has_roi = isinstance(lat, (list,tuple)) and isinstance(lon, (list,tuple))
        has_postal = (postal_code is not None and country is not None)
        if (has_poi or has_roi) and has_postal:
            raise ValueError("Specify exactly one location method:\nEither direct "
                             "from coordinates (lat/lon) OR from (postal_code+country).")
        if sum((has_poi,has_roi,has_postal)) != 1:
            raise Exception("Please select either point coordinates (lat, lon), "
                            "region coordinates (lat, lon as list) or point from "
                            "postal code + country")
        # Check what's the type of user request ROI / POI / POstal Code
        if has_roi:
            if (len(lat) != 2) or (len(lon) != 2):
                raise Exception("For ROI purchases user must pass `lat` and "
                                "`lon` as a list,\n(min_lat, max_lat) and"
                                "(min_lon, max_lon)")
            # Bounding box is: (North, West) to (South, East)
            lat, lon = sorted(lat, reverse=True), sorted(lon)
            return {"lat": float(lat[0]), "lon": float(lon[0]),
                    "lat2": float(lat[1]), "lon2": float(lon[1])}
        elif has_postal:
            return {"postalCode": self._check_postal_code(str(postal_code)),
                    "country": self._check_country_iso2(country),}
        else:
            return {"lat": float(lat), "lon": float(lon)}

    @staticmethod
    def _validate_year_range(year_from: int, year_to: int) -> None:
        min_year, max_year = 1979, 2080
        if year_from is None or year_to is None:
            raise ValueError("year_from and year_to must be provided.")
        try:
            yf = int(year_from)
            yt = int(year_to)
        except Exception as e:
            raise ValueError(f"year_from/year_to must be integers (got {year_from!r}, {year_to!r}).") from e
        if yf > yt:
            raise ValueError(f"Invalid year range: year_from ({yf}) must be <= year_to ({yt}).")
        if yf < min_year or yt > max_year:
            raise ValueError(f"Year range out of bounds: must be within {min_year}..{max_year} (got {yf}..{yt}).")

    @staticmethod
    def _check_postal_code(s: str) -> str:
        pc = str(s).strip()
        return re.sub(r"\s+", " ", pc)

    @staticmethod
    def _check_country_iso2(s: str) -> str:
        _COUNTRY_ALIASES = {
            "UK": "GB",
            "EL": "GR",
        }
        cc = str(s).strip().upper()
        return _COUNTRY_ALIASES.get(cc, cc)

    # ---------------------- public API ----------------------

    def authenticate(self, username: str, password: str, remember_me: bool = True) -> str:
        """
        Authenticate and obtain API token.

        Args:
            username: Sustax account username
            password: Sustax account password
            remember_me: Whether to maintain longer session

        Returns:
            JWT token string
        """
        url = f"{self.base_url}/api/authenticate"
        payload = {"username": username, "password": password, "rememberMe": remember_me}
        r = self.session_post.post(url, json=payload, timeout=(10, 60))
        r.raise_for_status()
        data = r.json()

        token = data.get("id_token")
        if not token:
            raise RuntimeError(f"Auth response did not include a token: {data}")

        self._creds_ok = True
        self._token = token
        self._username = username
        self._password = password
        self._remember_me = remember_me
        for s in (self.session_get, self.session_post):
            s.headers["Authorization"] = f"Bearer {token}"
        return token

    @_require_auth
    def get_variables_id(self) -> Dict[str, Any]:
        """
        Retrieves the full catalog of available Sustax datasets and scenarios.
        """
        url = f"{self.base_url}/api/getData"
        resp = self._authorized_get(url)
        return resp.json()

    @_require_auth
    def view_price_request(
        self,
        lat: Optional[Union[int,float,str,list,tuple]] = None,
        lon: Optional[Union[int,float,str,list,tuple]] = None,
        year_from: int = 1979,
        year_to: int = 2080,
        sustax_code_ids: List[int] = None,
        postal_code: Optional[str] = None,
        country: Optional[str] = None,
    ) -> Dict[str, Any]:
        """
        View the price (Grand Total) for a specific request, useful to run before
        purchasing any dataset or to set cost controls. Supports 3 location specifications
        that are:

            - Point of Interest: lat, lon as floats
            - Region of Interest: lat and lon as list [lat1, lat2], [lon1, lon2]
            - Postal code: postal_code + country (ISO-2 official format)
        """
        ## Checks
        if not sustax_code_ids:
            raise ValueError("Please pass a list of integers with the ID of"
                             "each Sustax dataset")
        self._validate_year_range(year_from, year_to)

        url = f"{self.base_url}/api/viewPriceRequest"
        payload: Dict[str, Any] = {
            "yearFrom": int(year_from),
            "yearTo": int(year_to),
            "sustaxCodes": [{"id": int(i)} for i in sustax_code_ids],
        }

        loc_payload = self._build_location_payload(lat = lat, lon = lon,
                                                   postal_code = postal_code,
                                                   country = country,)
        payload.update(loc_payload)

        resp = self._authorized_post(url, json=payload).json()
        message = resp.get("message", "")
        price = resp.get("price", None)
        separated_prices = resp.get("separatedPrices", {}) or {}

        return {'message':message} | {'Grand Total (Sustax coins)':price} | {'separated_prices' : separated_prices}

    @_require_auth
    def buy_data(
        self,
        lat: Optional[Union[int,float,str,list,tuple]] = None,
        lon: Optional[Union[int,float,str,list,tuple]] = None,
        year_from: int = 1979,
        year_to: int = 2080,
        sustax_code_ids: List[int] = None,
        postal_code: Optional[str] = None,
        country: Optional[str] = None,
        acceptance_sustax_disclaimer: bool = True,
    ) -> Dict[str, Any]:
        """
        Purchase Sustax data for specified time range and scenario IDs. Three
        types of data purchasing, based on locations specifications. The
        supported location specifications are:

            - Point of Interest: lat, lon as floats
            - Region of Interest: lat and lon as list [lat1, lat2], [lon1, lon2]
            - Postal code: postal_code + country (ISO-2 official format)

        Sustax Disclaimer is accepted by default in this class
            - acceptance_sustax_disclaimer. See https://sustax.earth/sustax-user-disclaimer/
        """
        ## Checks
        if not sustax_code_ids:
            raise ValueError("Please pass a list of integers with the ID of "
                             "each Sustax dataset")
        if acceptance_sustax_disclaimer != True:
            raise Exception("Sustax Disclaimer must be accepted, by passing "
                            "`acceptance_sustax_disclaimer = True` to proceed.\n"
                            "Please review it in: `https://sustax.earth/sustax-user-disclaimer/`")
        self._validate_year_range(year_from, year_to)

        url = f"{self.base_url}/api/buyData"
        payload: Dict[str, Any] = {
            "yearFrom": int(year_from),
            "yearTo": int(year_to),
            "sustaxCodes": [{"id": int(i)} for i in sustax_code_ids],
            # https://sustax.earth/sustax-user-disclaimer/
            "disclaimerAcceptance": bool(acceptance_sustax_disclaimer),
        }

        loc_payload = self._build_location_payload(lat = lat, lon = lon,
                                                   postal_code = postal_code,
                                                   country = country,)
        payload.update(loc_payload)
        return self._authorized_post(url, json=payload, timeout=(10, 1250)).json()

    @_require_auth
    def download_file(
        self,
        url: str,
        dest_dir: Union[Path, str, None] = None,
        chunk_size: int = 8192,
        mk_parents: bool = True,
        exist_ok: bool = True
    ) -> Path:
        """
        Download file from URL and save to destination directory.
        """
        dest_dir = Path(dest_dir) if dest_dir else Path.cwd()
        if mk_parents:
            dest_dir.mkdir(parents=True, exist_ok=exist_ok)

        # Extract filename from URL
        tokens = [s for s in url.split('_') if 'ID' in s]
        stem = tokens[0] if tokens else "download"
        filename = f"{stem}.zip"
        dest = dest_dir / filename

        # Stream download
        with self._authorized_get(url, stream=True) as r:
            with open(dest, "wb") as f:
                for chunk in r.iter_content(chunk_size=chunk_size):
                    if chunk:
                        f.write(chunk)

        self.dest = dest
        return dest

    def unzip_download(self, dest_dir: Union[Path, str, None] = None) -> Path:
        """
        Unzip the last downloaded ZIP file.

        Args:
            dest_dir: Extraction directory (defaults to zip location)

        Returns:
            Path to extraction directory
        """
        if not self.dest or not self.dest.exists():
            raise FileNotFoundError(
                "No downloaded ZIP found. Call download_file() first."
            )

        if dest_dir is None:
            dest_dir = self.dest.with_suffix("")
        dest_dir = Path(dest_dir)
        dest_dir.mkdir(parents=True, exist_ok=True)

        with zipfile.ZipFile(self.dest, "r") as zf:
            zf.extractall(dest_dir)

        return dest_dir

    @_require_auth
    def get_coordinates(self, lat: Union[int,float,str], lon: Union[int,float,str]) -> Dict[str, Any]:
        """
        Given a point of interest (lat/lon), returns the nearest available pixel
        coordinates where Sustax has measurement data.
        """
        url = f"{self.base_url}/api/getCoordinates"
        params = {"lat": float(lat), "lon": float(lon),}
        resp = self._authorized_get(url, params=params)
        return resp.json()

    @_require_auth
    def view_request_state(self, request_id: Union[int,str]) -> Dict[str, Any]:
        """
        Check processing state for a request by ID.
        """
        url = f"{self.base_url}/api/viewRequestState/{request_id}"
        resp = self._authorized_get(url)
        try:
            return resp.json()
        except Exception:
            return {"state": resp.text.strip()}

    @_require_auth
    def get_user_coins(self) -> int:
        """
        Retrieves the current Sustax credit balance for the authenticated user.
        """
        url = f"{self.base_url}/api/users/getUserCoins"
        resp = self._authorized_get(url)
        return resp.json()
Example Use of Python Class
#Load the Sustax client
C = SustaxClient()
# Authenticate
C.authenticate("your_username", "your_password")
# Generate a request to purchase data
r = C.buy_data((latitude, longitude),
				year_from=first_year,
				year_to=last_year,
				sustax_code_ids=list_of_Sustax_ID)
# Once the data is requested, in few minutes you get the request (variable 'r').
# Download your request. The downloading method returns
zip_file = C.download_file(r['url'], dest_dir = "storing_dir")
# Unzip the purchased data
dir_out = C.unzip_download("storing_dir_unzip")
Example Use of Additional Python functions
# Preview price for selected Sustax codes
quote = client.view_price_request(
    lat=lat_WGS84,
    lon=lon_WGS84,
    year_from=first_year,
    year_to=last_year,
    sustax_code_ids=[list_Sustax_scenarioID]
)
print(quote) # See the price in Sustax credits in a key of `quote`

# Check processing status of a specific request ID
status = client.view_request_state(your_Sustax_requestID)
print(status)              # e.g. {'state': 'COMPLETED'}
print(status.get('state')) # 'COMPLETED'